


signal strength 2 of 5

The Double Bottom pattern has been formed on #Bitcoin M15. This formation signals a reversal of the trend from downwards to upwards. The signal is that a buy trade should be opened after the upper boundary of the pattern 96350.17 is broken. The further movements will rely on the width of the current pattern 26191 points.
The M5 and M15 time frames may have more false entry points.
See Also
- All
- Double Top
- Flag
- Head and Shoulders
- Pennant
- Rectangle
- Triangle
- Triple top
- All
- #AAPL
- #AMZN
- #Bitcoin
- #EBAY
- #FB
- #GOOG
- #INTC
- #KO
- #MA
- #MCD
- #MSFT
- #NTDOY
- #PEP
- #TSLA
- #TWTR
- AUDCAD
- AUDCHF
- AUDJPY
- AUDUSD
- EURCAD
- EURCHF
- EURGBP
- EURJPY
- EURNZD
- EURRUB
- EURUSD
- GBPAUD
- GBPCHF
- GBPJPY
- GBPUSD
- GOLD
- NZDCAD
- NZDCHF
- NZDJPY
- NZDUSD
- SILVER
- USDCAD
- USDCHF
- USDJPY
- USDRUB
- All
- M5
- M15
- M30
- H1
- D1
- All
- Buy
- Sale
- All
- 1
- 2
- 3
- 4
- 5
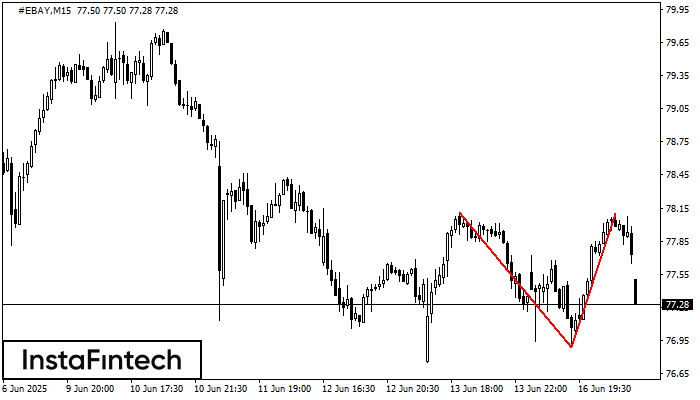
The Double Top reversal pattern has been formed on #EBAY M15. Characteristics: the upper boundary 78.11; the lower boundary 76.89; the width of the pattern is 121 points. Sell trades
The M5 and M15 time frames may have more false entry points.
Open chart in a new window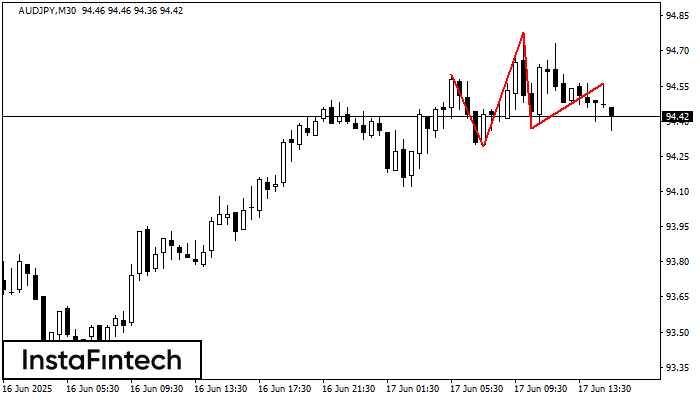
The AUDJPY M30 formed the Head and Shoulders pattern with the following features: The Head’s top is at 94.78, the Neckline and the upward angle are at 94.29/94.37. The formation
Open chart in a new window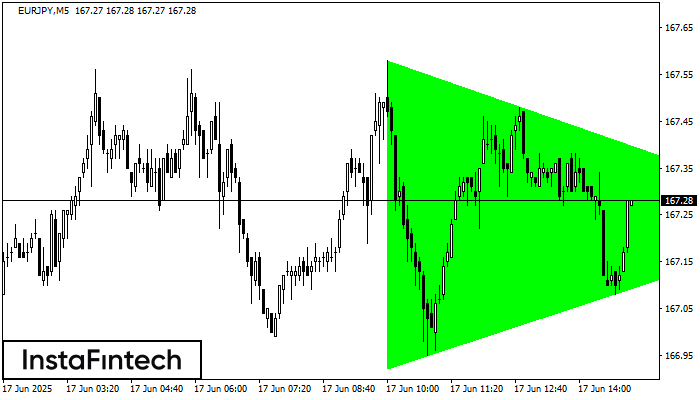
According to the chart of M5, EURJPY formed the Bullish Symmetrical Triangle pattern. The lower border of the pattern touches the coordinates 166.92/167.24 whereas the upper border goes across 167.58/167.24
The M5 and M15 time frames may have more false entry points.
Open chart in a new window


