


signal strength 2 of 5
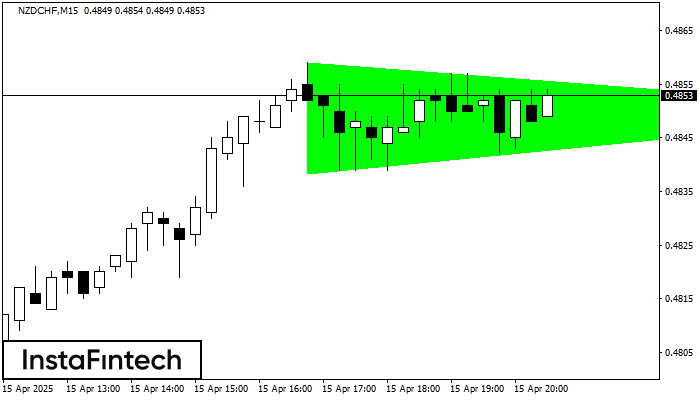
According to the chart of M15, NZDCHF formed the Bullish Symmetrical Triangle pattern, which signals the trend will continue. Description. The upper border of the pattern touches the coordinates 0.4859/0.4850 whereas the lower border goes across 0.4838/0.4850. The pattern width is measured on the chart at 21 pips. If the Bullish Symmetrical Triangle pattern is in progress during the upward trend, this indicates the current trend will go on. In case 0.4850 is broken, the price could continue its move toward 0.4873.
The M5 and M15 time frames may have more false entry points.
See Also
- All
- Double Top
- Flag
- Head and Shoulders
- Pennant
- Rectangle
- Triangle
- Triple top
- All
- #AAPL
- #AMZN
- #Bitcoin
- #EBAY
- #FB
- #GOOG
- #INTC
- #KO
- #MA
- #MCD
- #MSFT
- #NTDOY
- #PEP
- #TSLA
- #TWTR
- AUDCAD
- AUDCHF
- AUDJPY
- AUDUSD
- EURCAD
- EURCHF
- EURGBP
- EURJPY
- EURNZD
- EURRUB
- EURUSD
- GBPAUD
- GBPCHF
- GBPJPY
- GBPUSD
- GOLD
- NZDCAD
- NZDCHF
- NZDJPY
- NZDUSD
- SILVER
- USDCAD
- USDCHF
- USDJPY
- USDRUB
- All
- M5
- M15
- M30
- H1
- D1
- All
- Buy
- Sale
- All
- 1
- 2
- 3
- 4
- 5
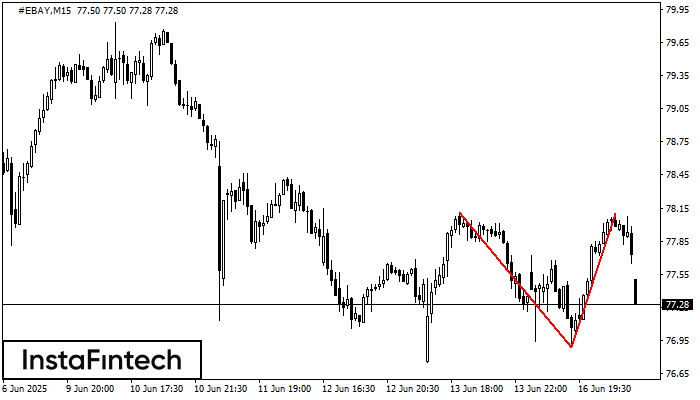
The Double Top reversal pattern has been formed on #EBAY M15. Characteristics: the upper boundary 78.11; the lower boundary 76.89; the width of the pattern is 121 points. Sell trades
The M5 and M15 time frames may have more false entry points.
Open chart in a new window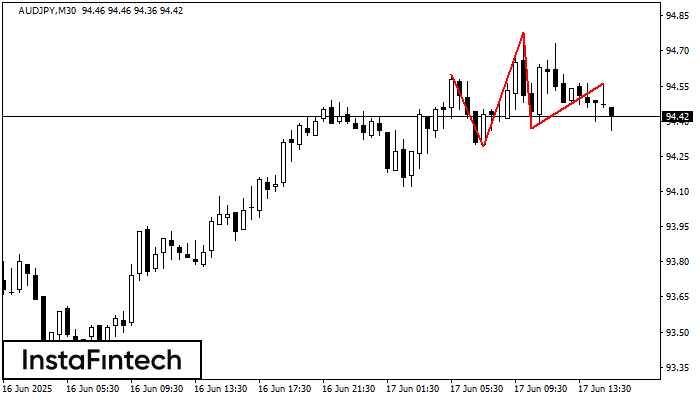
The AUDJPY M30 formed the Head and Shoulders pattern with the following features: The Head’s top is at 94.78, the Neckline and the upward angle are at 94.29/94.37. The formation
Open chart in a new window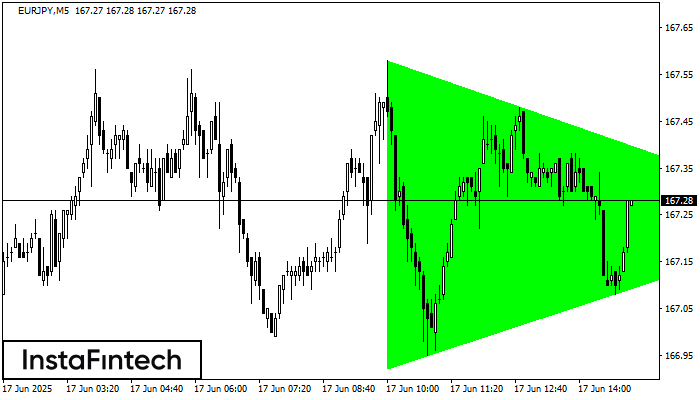
According to the chart of M5, EURJPY formed the Bullish Symmetrical Triangle pattern. The lower border of the pattern touches the coordinates 166.92/167.24 whereas the upper border goes across 167.58/167.24
The M5 and M15 time frames may have more false entry points.
Open chart in a new window


