

signal strength 2 of 5
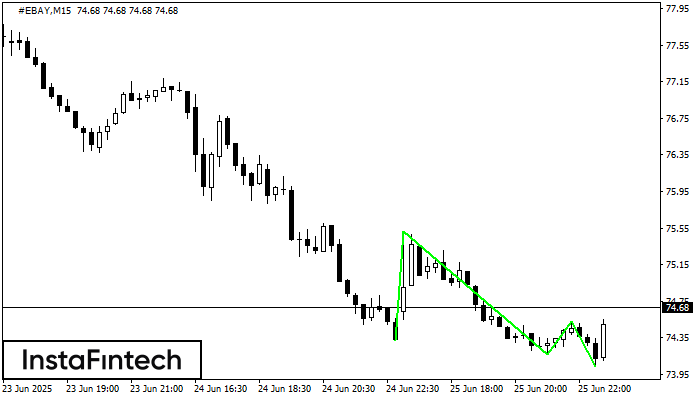
The Triple Bottom pattern has been formed on #EBAY M15. It has the following characteristics: resistance level 75.51/74.53; support level 74.32/74.04; the width is 119 points. In the event of a breakdown of the resistance level of 75.51, the price is likely to continue an upward movement at least to 74.39.
The M5 and M15 time frames may have more false entry points.
See Also
- All
- Double Top
- Flag
- Head and Shoulders
- Pennant
- Rectangle
- Triangle
- Triple top
- All
- #AAPL
- #AMZN
- #Bitcoin
- #EBAY
- #FB
- #GOOG
- #INTC
- #KO
- #MA
- #MCD
- #MSFT
- #NTDOY
- #PEP
- #TSLA
- #TWTR
- AUDCAD
- AUDCHF
- AUDJPY
- AUDUSD
- EURCAD
- EURCHF
- EURGBP
- EURJPY
- EURNZD
- EURRUB
- EURUSD
- GBPAUD
- GBPCHF
- GBPJPY
- GBPUSD
- GOLD
- NZDCAD
- NZDCHF
- NZDJPY
- NZDUSD
- SILVER
- USDCAD
- USDCHF
- USDJPY
- USDRUB
- All
- M5
- M15
- M30
- H1
- D1
- All
- Buy
- Sale
- All
- 1
- 2
- 3
- 4
- 5
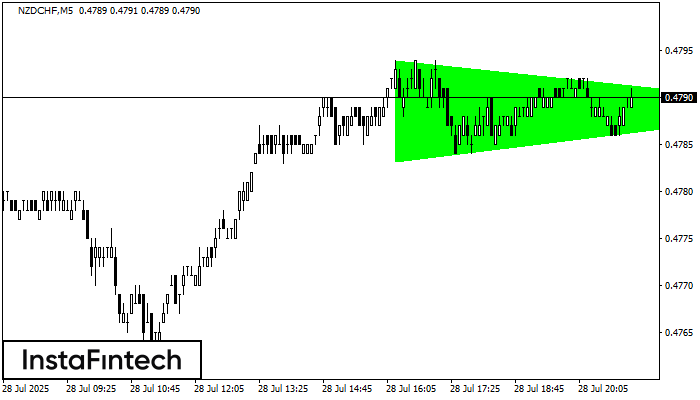
According to the chart of M5, NZDCHF formed the Bullish Symmetrical Triangle pattern. Description: This is the pattern of a trend continuation. 0.4794 and 0.4783 are the coordinates
The M5 and M15 time frames may have more false entry points.
Open chart in a new window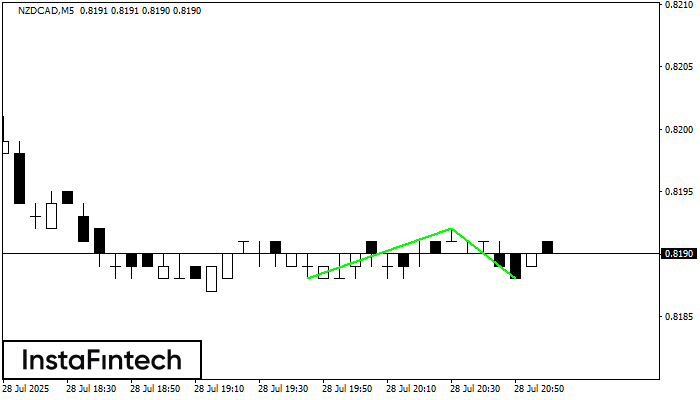
The Double Bottom pattern has been formed on NZDCAD M5. Characteristics: the support level 0.8188; the resistance level 0.8192; the width of the pattern 4 points. If the resistance level
The M5 and M15 time frames may have more false entry points.
Open chart in a new window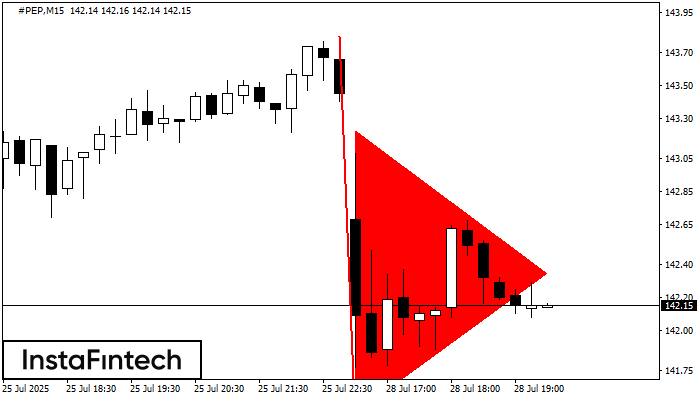
The Bearish pennant pattern has formed on the #PEP M15 chart. It signals potential continuation of the existing trend. Specifications: the pattern’s bottom has the coordinate of 141.49; the projection
The M5 and M15 time frames may have more false entry points.
Open chart in a new window


