


signal strength 2 of 5
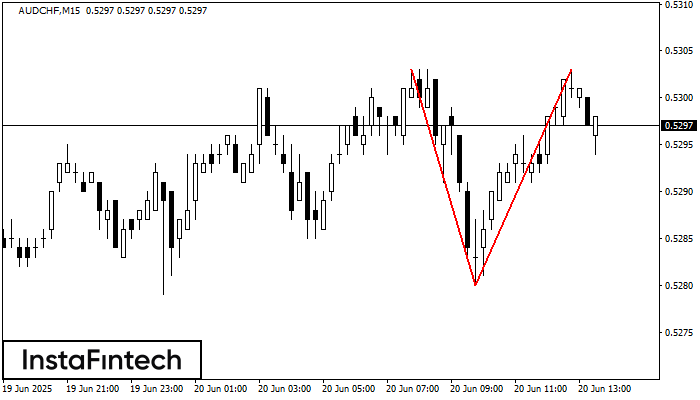
The Double Top reversal pattern has been formed on AUDCHF M15. Characteristics: the upper boundary 0.5303; the lower boundary 0.5280; the width of the pattern is 23 points. Sell trades are better to be opened below the lower boundary 0.5280 with a possible movements towards the 0.5257 level.
The M5 and M15 time frames may have more false entry points.
See Also
- All
- Double Top
- Flag
- Head and Shoulders
- Pennant
- Rectangle
- Triangle
- Triple top
- All
- #AAPL
- #AMZN
- #Bitcoin
- #EBAY
- #FB
- #GOOG
- #INTC
- #KO
- #MA
- #MCD
- #MSFT
- #NTDOY
- #PEP
- #TSLA
- #TWTR
- AUDCAD
- AUDCHF
- AUDJPY
- AUDUSD
- EURCAD
- EURCHF
- EURGBP
- EURJPY
- EURNZD
- EURRUB
- EURUSD
- GBPAUD
- GBPCHF
- GBPJPY
- GBPUSD
- GOLD
- NZDCAD
- NZDCHF
- NZDJPY
- NZDUSD
- SILVER
- USDCAD
- USDCHF
- USDJPY
- USDRUB
- All
- M5
- M15
- M30
- H1
- D1
- All
- Buy
- Sale
- All
- 1
- 2
- 3
- 4
- 5
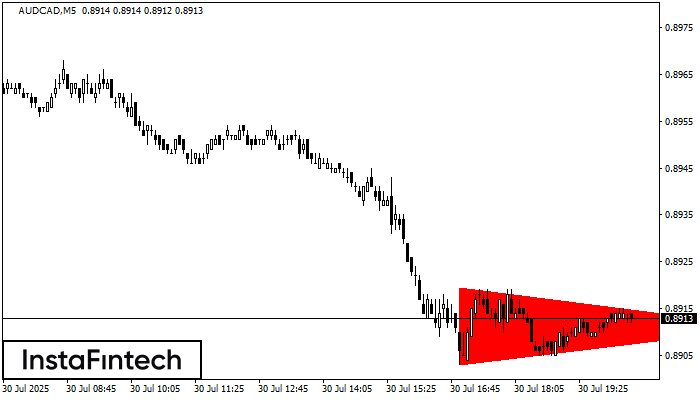
Según el gráfico de M5, el AUDCAD formó el patrón Triángulo Simétrico Bajista. Este patrón señala una tendencia bajista en caso de que el límite inferior 0.8903 sea roto. Aquí
Los marcos de tiempo M5 y M15 pueden tener más puntos de entrada falsos.
Open chart in a new window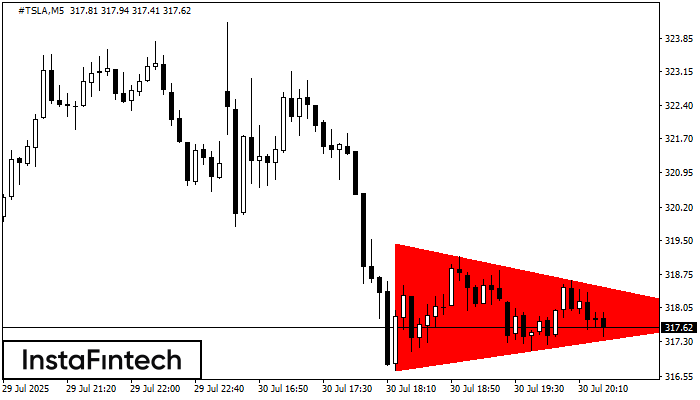
Según el gráfico de M5, el #TSLA formó el patrón Triángulo Simétrico Bajista. Este patrón señala una tendencia bajista en caso de que el límite inferior 316.69 sea roto. Aquí
Los marcos de tiempo M5 y M15 pueden tener más puntos de entrada falsos.
Open chart in a new window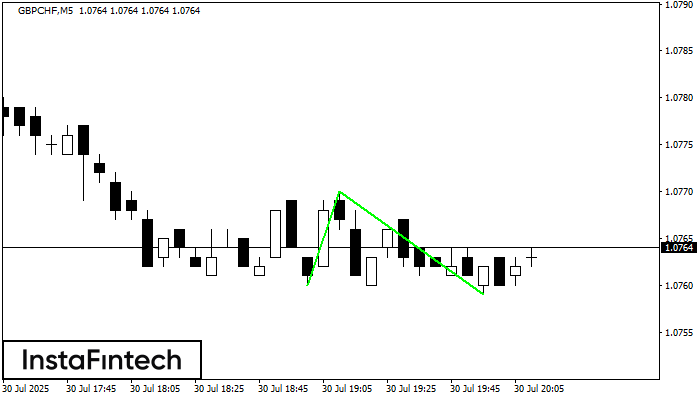
El patrón Doble Piso ha sido formado en GBPCHF M5. Características: el nivel de soporte 1.0760; el nivel de resistencia 1.0770; el ancho del patrón 10 puntos. Si el nivel
Los marcos de tiempo M5 y M15 pueden tener más puntos de entrada falsos.
Open chart in a new window


