

signal strength 2 of 5
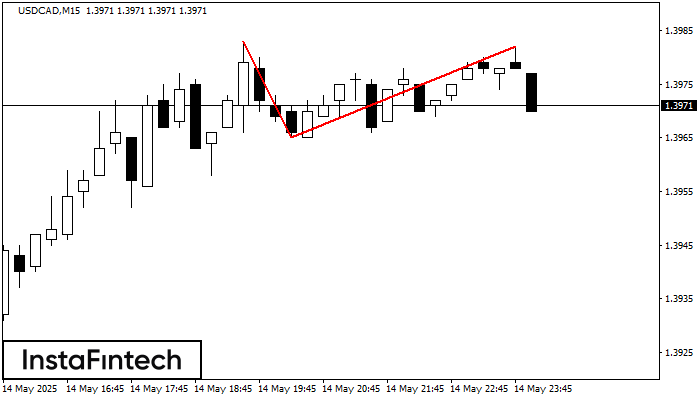
The Double Top pattern has been formed on USDCAD M15. It signals that the trend has been changed from upwards to downwards. Probably, if the base of the pattern 1.3965 is broken, the downward movement will continue.
The M5 and M15 time frames may have more false entry points.
See Also
- All
- Double Top
- Flag
- Head and Shoulders
- Pennant
- Rectangle
- Triangle
- Triple top
- All
- #AAPL
- #AMZN
- #Bitcoin
- #EBAY
- #FB
- #GOOG
- #INTC
- #KO
- #MA
- #MCD
- #MSFT
- #NTDOY
- #PEP
- #TSLA
- #TWTR
- AUDCAD
- AUDCHF
- AUDJPY
- AUDUSD
- EURCAD
- EURCHF
- EURGBP
- EURJPY
- EURNZD
- EURRUB
- EURUSD
- GBPAUD
- GBPCHF
- GBPJPY
- GBPUSD
- GOLD
- NZDCAD
- NZDCHF
- NZDJPY
- NZDUSD
- SILVER
- USDCAD
- USDCHF
- USDJPY
- USDRUB
- All
- M5
- M15
- M30
- H1
- D1
- All
- Buy
- Sale
- All
- 1
- 2
- 3
- 4
- 5
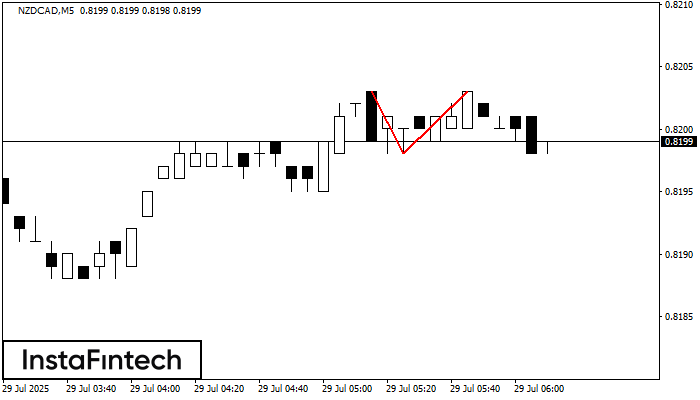
El patrón de reversión Doble Techo ha sido formado en NZDCAD M5. Características: el límite superior 0.8203; el límite inferior 0.8198; el ancho del patrón es 5 puntos. Es mejor
Los marcos de tiempo M5 y M15 pueden tener más puntos de entrada falsos.
Open chart in a new window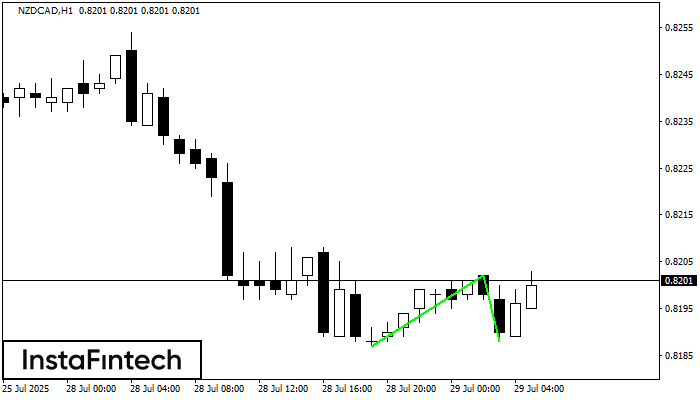
El patrón Doble Piso ha sido formado en NZDCAD H1. Características: el nivel de soporte 0.8187; el nivel de resistencia 0.8202; el ancho del patrón 15 puntos. Si el nivel
Open chart in a new window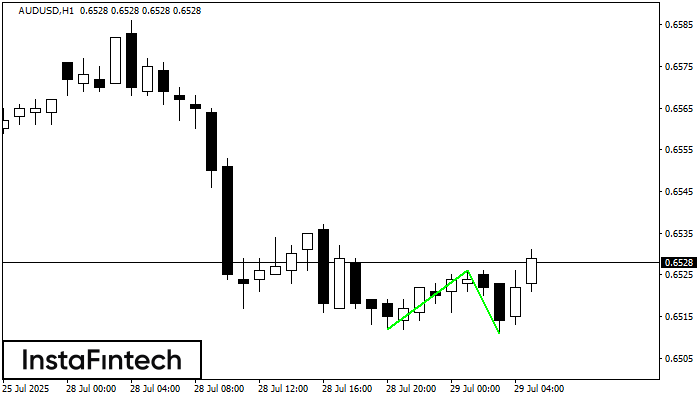
El patrón Doble Piso ha sido formado en AUDUSD H1; el límite superior es 0.6526; el límite inferior es 0.6511. El ancho del patrón es 14 puntos. En caso
Open chart in a new window


