


signal strength 2 of 5
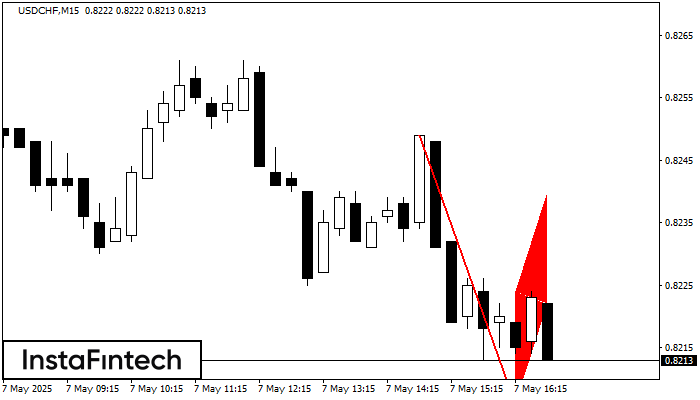
The Bearish Flag pattern has been formed on USDCHF at M15. The lower boundary of the pattern is located at 0.8206/0.8222 while the upper boundary lies at 0.8224/0.8240. The projection of the flagpole is 43 points. This formation signals that the downward trend is most likely to continue. Therefore, if the level of 0.8206 is broken, the price will move further downwards.
The M5 and M15 time frames may have more false entry points.
- All
- Double Top
- Flag
- Head and Shoulders
- Pennant
- Rectangle
- Triangle
- Triple top
- All
- #AAPL
- #AMZN
- #Bitcoin
- #EBAY
- #FB
- #GOOG
- #INTC
- #KO
- #MA
- #MCD
- #MSFT
- #NTDOY
- #PEP
- #TSLA
- #TWTR
- AUDCAD
- AUDCHF
- AUDJPY
- AUDUSD
- EURCAD
- EURCHF
- EURGBP
- EURJPY
- EURNZD
- EURRUB
- EURUSD
- GBPAUD
- GBPCHF
- GBPJPY
- GBPUSD
- GOLD
- NZDCAD
- NZDCHF
- NZDJPY
- NZDUSD
- SILVER
- USDCAD
- USDCHF
- USDJPY
- USDRUB
- All
- M5
- M15
- M30
- H1
- D1
- All
- Buy
- Sale
- All
- 1
- 2
- 3
- 4
- 5

El patrón de reversión Doble Techo ha sido formado en #Bitcoin M30. Características: el límite superior 105283.16; el límite inferior 103816.55; el ancho del patrón es 147353 puntos. Es mejor
Open chart in a new window
En el gráfico de USDCAD M15 el patrón de reversión Doble Techo ha sido formado. Características: límite superior 1.3702; límite inferior 1.3668; el ancho del patrón 34 puntos. La señal
Los marcos de tiempo M5 y M15 pueden tener más puntos de entrada falsos.
Open chart in a new window
Según el gráfico de M15, el AUDJPY formó el patrón Triángulo Simétrico Alcista. El límite inferior del patrón toca las coordenadas 93.96/94.02 donde el límite superior cruza 94.07/94.02
Los marcos de tiempo M5 y M15 pueden tener más puntos de entrada falsos.
Open chart in a new window


