signal strength 4 of 5

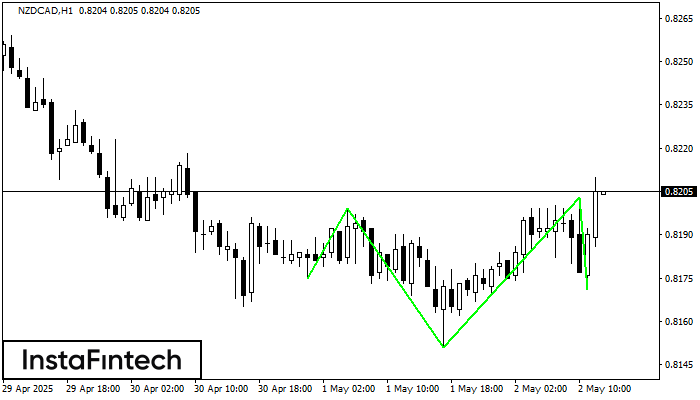
According to the chart of H1, NZDCAD produced the pattern termed the Inverse Head and Shoulder. The Head is fixed at 0.8151 while the median line of the Neck is set at 0.8199/0.8203. The formation of the Inverse Head and Shoulder Pattern clearly indicates a reversal of the downward trend. In means that in case the scenario comes true, the price of NZDCAD will go towards 0.8243.
See Also
- All
- Double Top
- Flag
- Head and Shoulders
- Pennant
- Rectangle
- Triangle
- Triple top
- All
- #AAPL
- #AMZN
- #Bitcoin
- #EBAY
- #FB
- #GOOG
- #INTC
- #KO
- #MA
- #MCD
- #MSFT
- #NTDOY
- #PEP
- #TSLA
- #TWTR
- AUDCAD
- AUDCHF
- AUDJPY
- AUDUSD
- EURCAD
- EURCHF
- EURGBP
- EURJPY
- EURNZD
- EURRUB
- EURUSD
- GBPAUD
- GBPCHF
- GBPJPY
- GBPUSD
- GOLD
- NZDCAD
- NZDCHF
- NZDJPY
- NZDUSD
- SILVER
- USDCAD
- USDCHF
- USDJPY
- USDRUB
- All
- M5
- M15
- M30
- H1
- D1
- All
- Buy
- Sale
- All
- 1
- 2
- 3
- 4
- 5
On the chart of NZDJPY H1 the Double Top reversal pattern has been formed. Characteristics: the upper boundary 87.00; the lower boundary 86.53; the width of the pattern 47 points
Open chart in a new windowThe Double Bottom pattern has been formed on GBPJPY M5. Characteristics: the support level 194.78; the resistance level 194.96; the width of the pattern 18 points. If the resistance level
The M5 and M15 time frames may have more false entry points.
Open chart in a new windowThe Double Bottom pattern has been formed on GBPCHF M5; the upper boundary is 1.1120; the lower boundary is 1.1113. The width of the pattern is 7 points. In case
The M5 and M15 time frames may have more false entry points.
Open chart in a new window