

signal strength 3 of 5
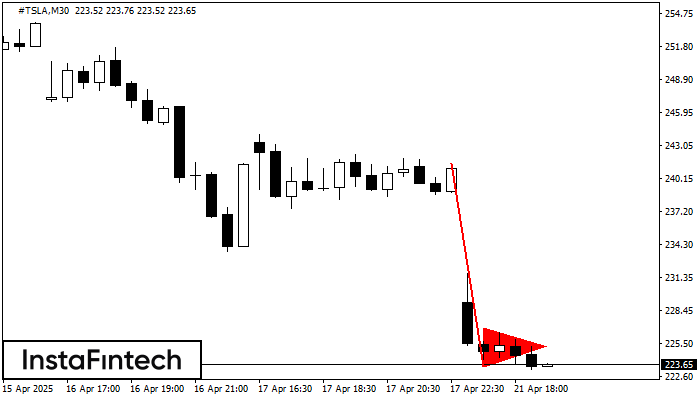
The Bearish pennant pattern has formed on the #TSLA M30 chart. It signals potential continuation of the existing trend. Specifications: the pattern’s bottom has the coordinate of 223.47; the projection of the flagpole height is equal to 1803 pips. In case the price breaks out the pattern’s bottom of 223.47, the downtrend is expected to continue for further level 223.17.
See Also
- All
- Double Top
- Flag
- Head and Shoulders
- Pennant
- Rectangle
- Triangle
- Triple top
- All
- #AAPL
- #AMZN
- #Bitcoin
- #EBAY
- #FB
- #GOOG
- #INTC
- #KO
- #MA
- #MCD
- #MSFT
- #NTDOY
- #PEP
- #TSLA
- #TWTR
- AUDCAD
- AUDCHF
- AUDJPY
- AUDUSD
- EURCAD
- EURCHF
- EURGBP
- EURJPY
- EURNZD
- EURRUB
- EURUSD
- GBPAUD
- GBPCHF
- GBPJPY
- GBPUSD
- GOLD
- NZDCAD
- NZDCHF
- NZDJPY
- NZDUSD
- SILVER
- USDCAD
- USDCHF
- USDJPY
- USDRUB
- All
- M5
- M15
- M30
- H1
- D1
- All
- Buy
- Sale
- All
- 1
- 2
- 3
- 4
- 5
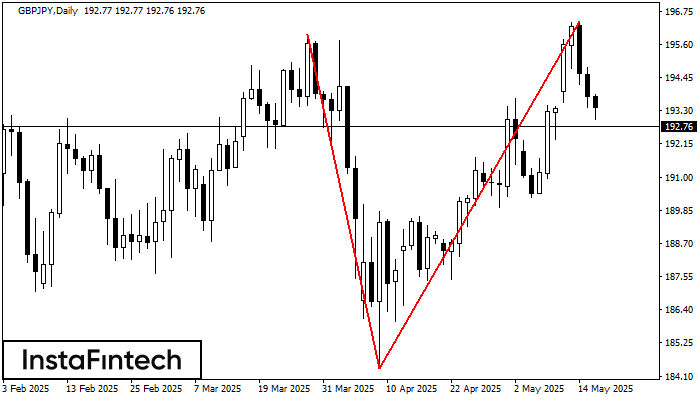
The Double Top reversal pattern has been formed on GBPJPY D1. Characteristics: the upper boundary 195.94; the lower boundary 184.35; the width of the pattern is 1203 points. Sell trades
Open chart in a new window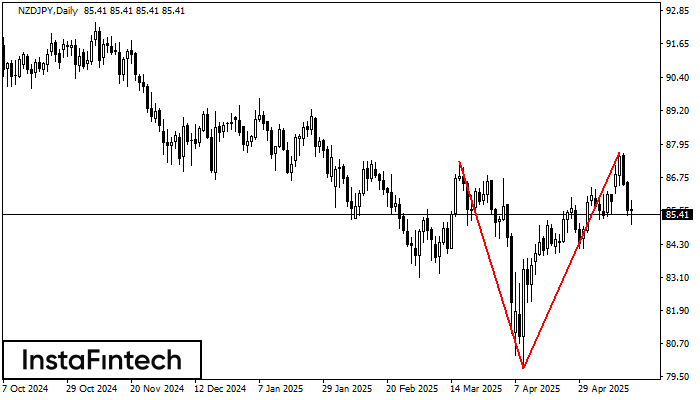
The Double Top reversal pattern has been formed on NZDJPY D1. Characteristics: the upper boundary 87.33; the lower boundary 79.77; the width of the pattern is 792 points. Sell trades
Open chart in a new window
The Triple Bottom pattern has been formed on #Bitcoin M30. It has the following characteristics: resistance level 103658.13/103057.03; support level 102549.85/102590.27; the width is 110828 points. In the event
Open chart in a new window


