

signal strength 1 of 5
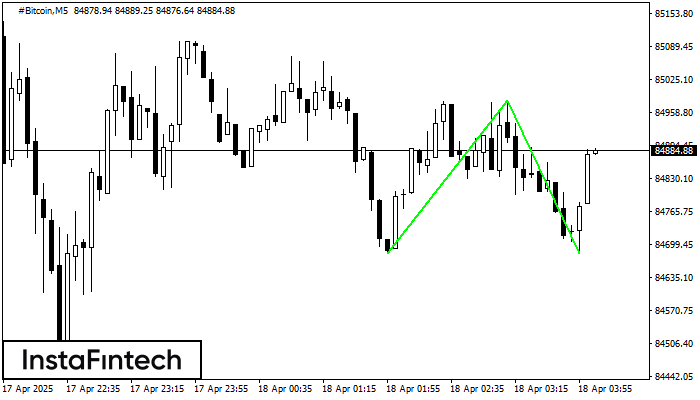
The Double Bottom pattern has been formed on #Bitcoin M5. Characteristics: the support level 84682.60; the resistance level 84984.00; the width of the pattern 30140 points. If the resistance level is broken, a change in the trend can be predicted with the first target point lying at the distance of 30098 points.
The M5 and M15 time frames may have more false entry points.
- All
- Double Top
- Flag
- Head and Shoulders
- Pennant
- Rectangle
- Triangle
- Triple top
- All
- #AAPL
- #AMZN
- #Bitcoin
- #EBAY
- #FB
- #GOOG
- #INTC
- #KO
- #MA
- #MCD
- #MSFT
- #NTDOY
- #PEP
- #TSLA
- #TWTR
- AUDCAD
- AUDCHF
- AUDJPY
- AUDUSD
- EURCAD
- EURCHF
- EURGBP
- EURJPY
- EURNZD
- EURRUB
- EURUSD
- GBPAUD
- GBPCHF
- GBPJPY
- GBPUSD
- GOLD
- NZDCAD
- NZDCHF
- NZDJPY
- NZDUSD
- SILVER
- USDCAD
- USDCHF
- USDJPY
- USDRUB
- All
- M5
- M15
- M30
- H1
- D1
- All
- Buy
- Sale
- All
- 1
- 2
- 3
- 4
- 5
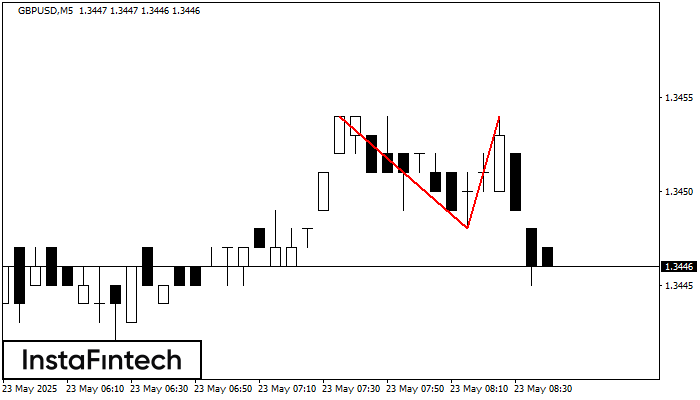
On the chart of GBPUSD M5 the Double Top reversal pattern has been formed. Characteristics: the upper boundary 1.3454; the lower boundary 1.3448; the width of the pattern 6 points
The M5 and M15 time frames may have more false entry points.
Open chart in a new window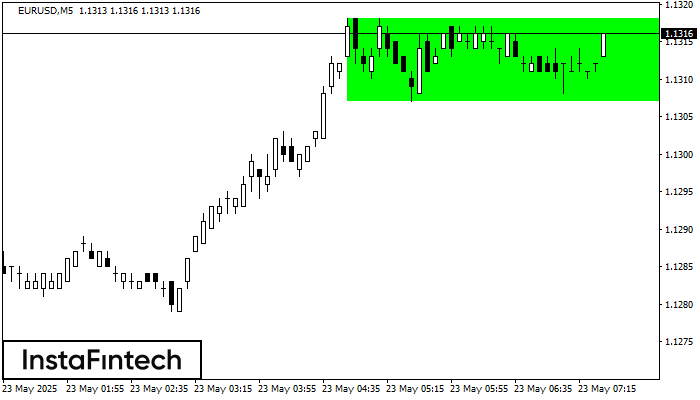
According to the chart of M5, EURUSD formed the Bullish Rectangle. This type of a pattern indicates a trend continuation. It consists of two levels: resistance 1.1318 and support 1.1307
The M5 and M15 time frames may have more false entry points.
Open chart in a new window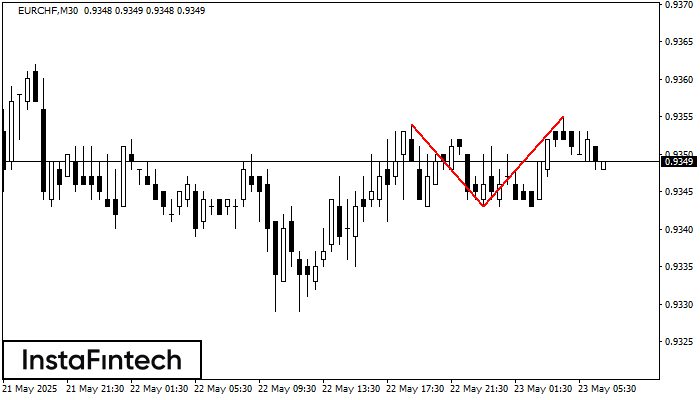
The Double Top pattern has been formed on EURCHF M30. It signals that the trend has been changed from upwards to downwards. Probably, if the base of the pattern 0.9343
Open chart in a new window


