


Actual patterns
Patterns are graphical models which are formed in the chart by the price. According to one of the technical analysis postulates, history (price movement) repeats itself. It means that the price movements are often similar in the same situations which makes it possible to predict the further development of the situation with a high probability.
Actual Patterns
- All
- Double Top
- Flag
- Head and Shoulders
- Pennant
- Rectangle
- Triangle
- Triple top
- All
- #AAPL
- #AMZN
- #Bitcoin
- #EBAY
- #FB
- #GOOG
- #INTC
- #KO
- #MA
- #MCD
- #MSFT
- #NTDOY
- #PEP
- #TSLA
- #TWTR
- AUDCAD
- AUDCHF
- AUDJPY
- AUDUSD
- EURCAD
- EURCHF
- EURGBP
- EURJPY
- EURNZD
- EURRUB
- EURUSD
- GBPAUD
- GBPCHF
- GBPJPY
- GBPUSD
- GOLD
- NZDCAD
- NZDCHF
- NZDJPY
- NZDUSD
- SILVER
- USDCAD
- USDCHF
- USDJPY
- USDRUB
- All
- M5
- M15
- M30
- H1
- D1
- All
- Buy
- Sale
- All
- 1
- 2
- 3
- 4
- 5
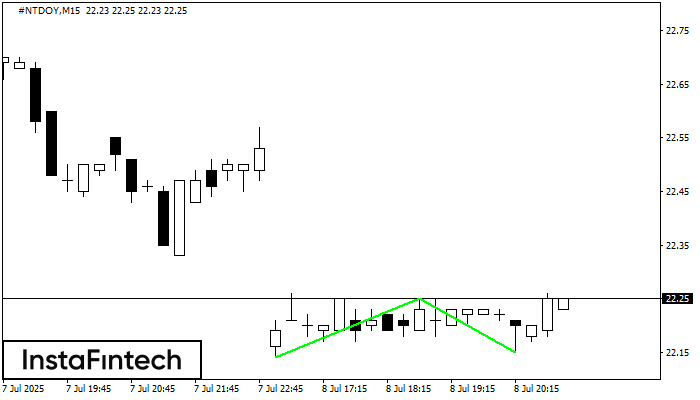
The Double Bottom pattern has been formed on #NTDOY M15. Characteristics: the support level 22.14; the resistance level 22.25; the width of the pattern 11 points. If the resistance level
The M5 and M15 time frames may have more false entry points.
Open chart in a new window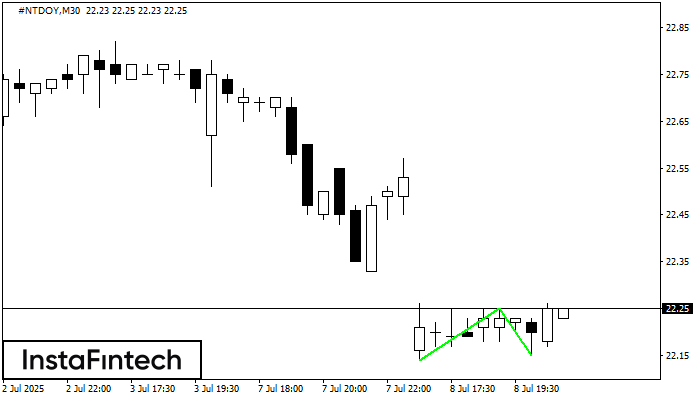
The Double Bottom pattern has been formed on #NTDOY M30. Characteristics: the support level 22.14; the resistance level 22.25; the width of the pattern 11 points. If the resistance level
Open chart in a new window
The Double Bottom pattern has been formed on #NTDOY M30. Characteristics: the support level 22.14; the resistance level 22.25; the width of the pattern 11 points. If the resistance level
Open chart in a new window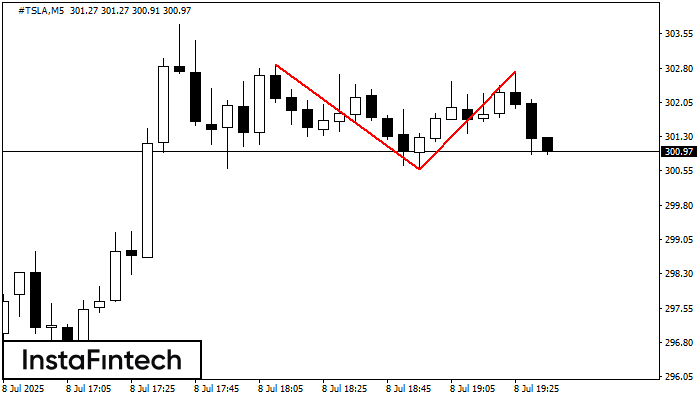
The Double Top reversal pattern has been formed on #TSLA M5. Characteristics: the upper boundary 302.87; the lower boundary 300.59; the width of the pattern is 214 points. Sell trades
The M5 and M15 time frames may have more false entry points.
Open chart in a new window
The Bearish pennant pattern has formed on the #TSLA M5 chart. The pattern signals continuation of the downtrend in case the pennant’s low of 288.55 is broken through. Recommendations: Place
The M5 and M15 time frames may have more false entry points.
Open chart in a new window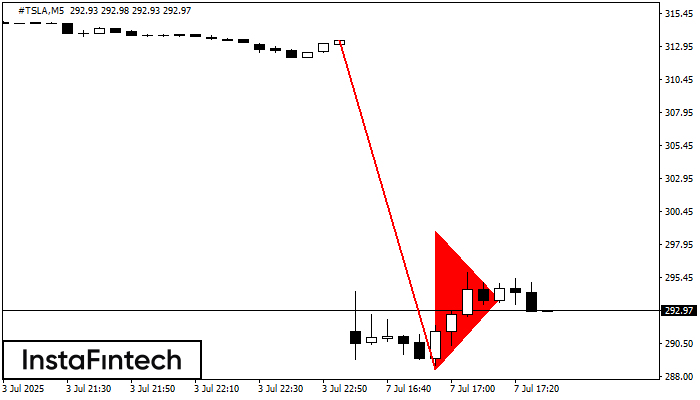
The Bearish pennant pattern has formed on the #TSLA M5 chart. The pattern signals continuation of the downtrend in case the pennant’s low of 288.55 is broken through. Recommendations: Place
The M5 and M15 time frames may have more false entry points.
Open chart in a new window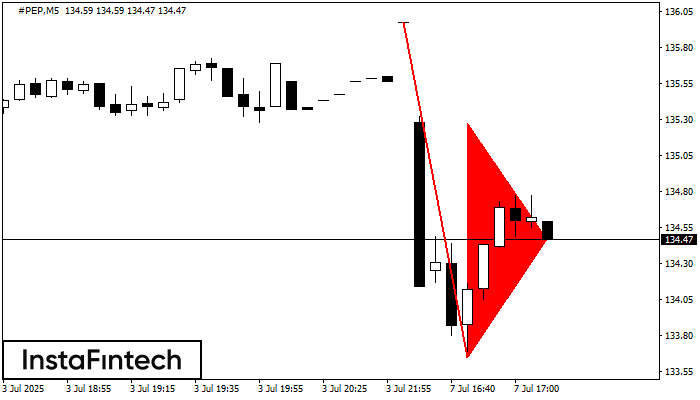
The Bearish pennant pattern has formed on the #PEP M5 chart. It signals potential continuation of the existing trend. Specifications: the pattern’s bottom has the coordinate of 133.65; the projection
The M5 and M15 time frames may have more false entry points.
Open chart in a new window
The Bearish pennant pattern has formed on the #PEP M5 chart. The pattern signals continuation of the downtrend in case the pennant’s low of 133.65 is broken through. Recommendations: Place
The M5 and M15 time frames may have more false entry points.
Open chart in a new window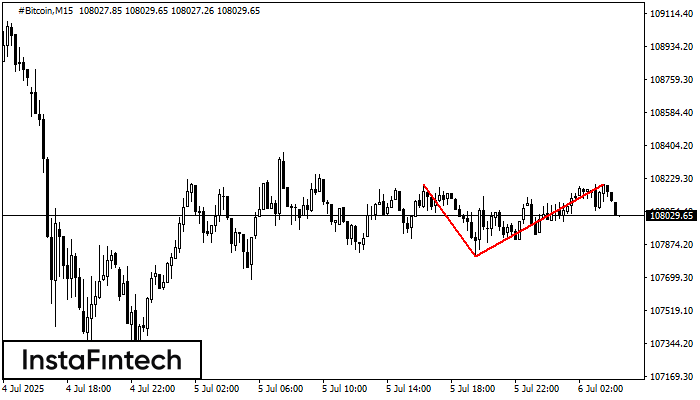
On the chart of #Bitcoin M15 the Double Top reversal pattern has been formed. Characteristics: the upper boundary 108196.50; the lower boundary 107810.44; the width of the pattern 38606 points
The M5 and M15 time frames may have more false entry points.
Open chart in a new window


