

signal strength 2 of 5
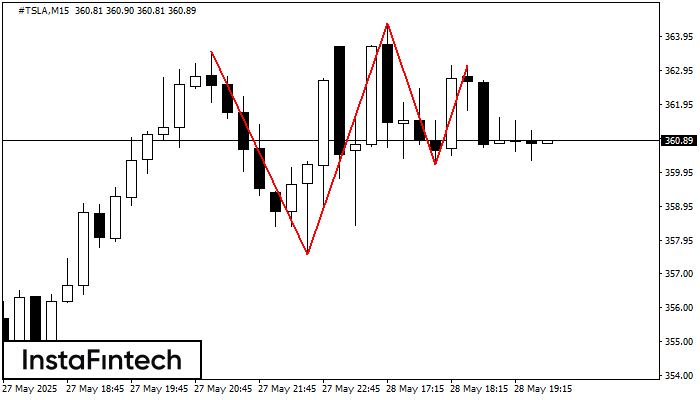
On the chart of the #TSLA M15 trading instrument, the Triple Top pattern that signals a trend change has formed. It is possible that after formation of the third peak, the price will try to break through the resistance level 357.56, where we advise to open a trading position for sale. Take profit is the projection of the pattern’s width, which is 594 points.
The M5 and M15 time frames may have more false entry points.
See Also
- All
- Double Top
- Flag
- Head and Shoulders
- Pennant
- Rectangle
- Triangle
- Triple top
- All
- #AAPL
- #AMZN
- #Bitcoin
- #EBAY
- #FB
- #GOOG
- #INTC
- #KO
- #MA
- #MCD
- #MSFT
- #NTDOY
- #PEP
- #TSLA
- #TWTR
- AUDCAD
- AUDCHF
- AUDJPY
- AUDUSD
- EURCAD
- EURCHF
- EURGBP
- EURJPY
- EURNZD
- EURRUB
- EURUSD
- GBPAUD
- GBPCHF
- GBPJPY
- GBPUSD
- GOLD
- NZDCAD
- NZDCHF
- NZDJPY
- NZDUSD
- SILVER
- USDCAD
- USDCHF
- USDJPY
- USDRUB
- All
- M5
- M15
- M30
- H1
- D1
- All
- Buy
- Sale
- All
- 1
- 2
- 3
- 4
- 5
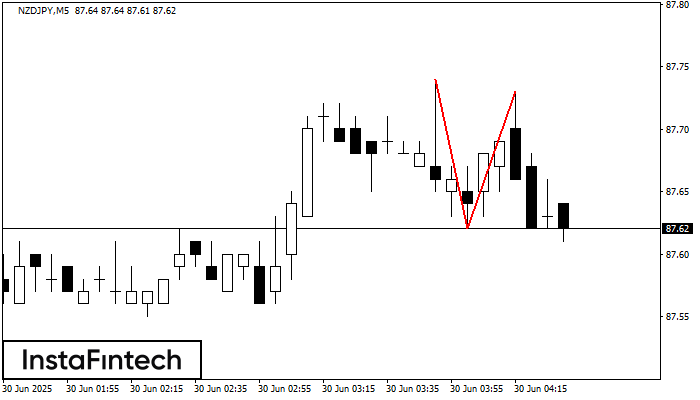
The Double Top reversal pattern has been formed on NZDJPY M5. Characteristics: the upper boundary 87.74; the lower boundary 87.62; the width of the pattern is 11 points. Sell trades
The M5 and M15 time frames may have more false entry points.
Open chart in a new window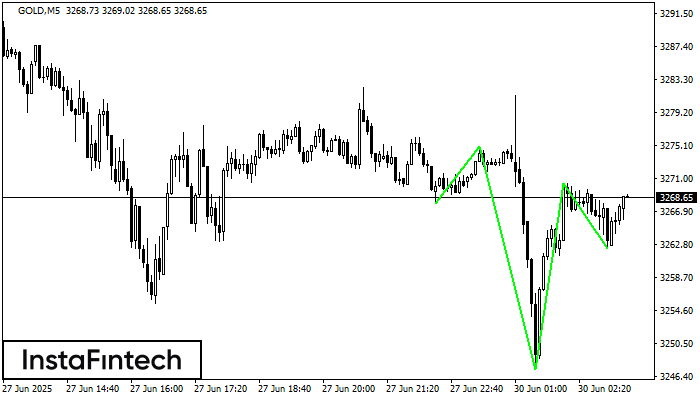
According to the chart of M5, GOLD produced the pattern termed the Inverse Head and Shoulder. The Head is fixed at 3247.25 while the median line of the Neck
The M5 and M15 time frames may have more false entry points.
Open chart in a new window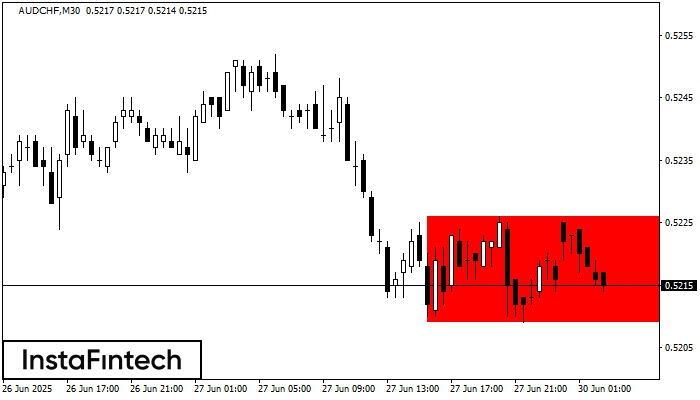
According to the chart of M30, AUDCHF formed the Bearish Rectangle. The pattern indicates a trend continuation. The upper border is 0.5226, the lower border is 0.5209. The signal means
Open chart in a new window


