

signal strength 1 of 5
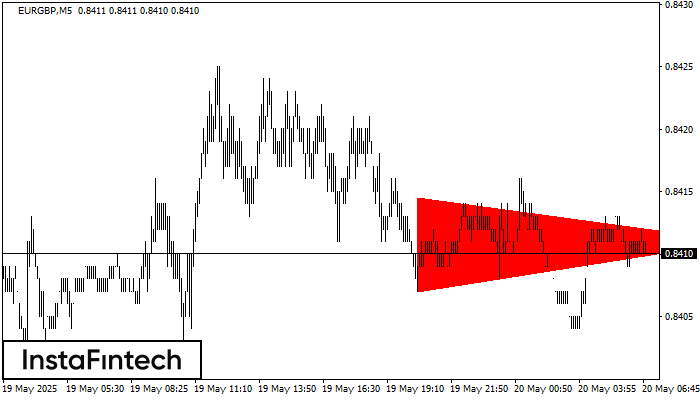
According to the chart of M5, EURGBP formed the Bearish Symmetrical Triangle pattern. This pattern signals a further downward trend in case the lower border 0.8407 is breached. Here, a hypothetical profit will equal the width of the available pattern that is -8 pips.
The M5 and M15 time frames may have more false entry points.
See Also
- All
- Double Top
- Flag
- Head and Shoulders
- Pennant
- Rectangle
- Triangle
- Triple top
- All
- #AAPL
- #AMZN
- #Bitcoin
- #EBAY
- #FB
- #GOOG
- #INTC
- #KO
- #MA
- #MCD
- #MSFT
- #NTDOY
- #PEP
- #TSLA
- #TWTR
- AUDCAD
- AUDCHF
- AUDJPY
- AUDUSD
- EURCAD
- EURCHF
- EURGBP
- EURJPY
- EURNZD
- EURRUB
- EURUSD
- GBPAUD
- GBPCHF
- GBPJPY
- GBPUSD
- GOLD
- NZDCAD
- NZDCHF
- NZDJPY
- NZDUSD
- SILVER
- USDCAD
- USDCHF
- USDJPY
- USDRUB
- All
- M5
- M15
- M30
- H1
- D1
- All
- Buy
- Sale
- All
- 1
- 2
- 3
- 4
- 5
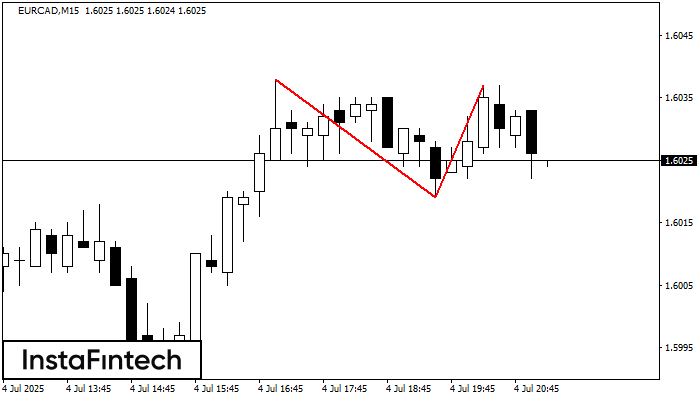
The Double Top pattern has been formed on EURCAD M15. It signals that the trend has been changed from upwards to downwards. Probably, if the base of the pattern 1.6019
The M5 and M15 time frames may have more false entry points.
Open chart in a new window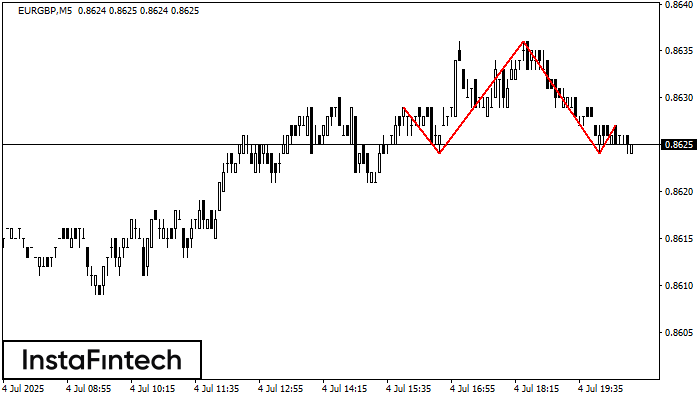
According to the chart of M5, EURGBP formed the Head and Shoulders pattern. The Head’s top is set at 0.8636 while the median line of the Neck is found
The M5 and M15 time frames may have more false entry points.
Open chart in a new window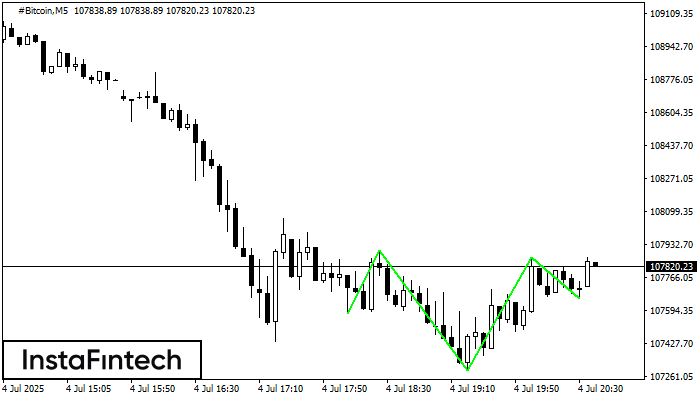
According to the chart of M5, #Bitcoin produced the pattern termed the Inverse Head and Shoulder. The Head is fixed at 107290.48 while the median line of the Neck
The M5 and M15 time frames may have more false entry points.
Open chart in a new window


