signal strength 3 of 5

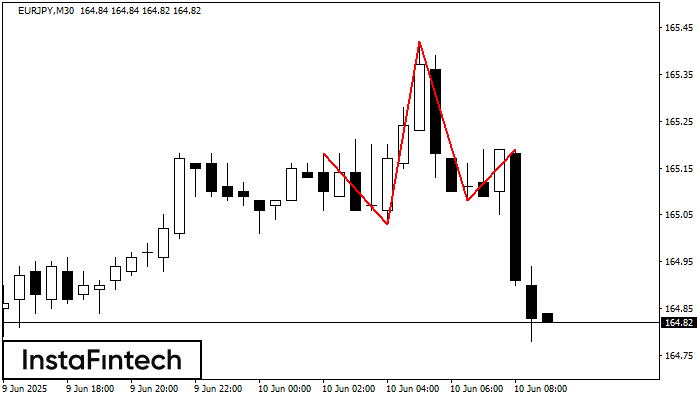
The technical pattern called Head and Shoulders has appeared on the chart of EURJPY M30. There are weighty reasons to suggest that the price will surpass the Neckline 165.03/165.08 after the right shoulder has been formed. So, the trend is set to change with the price heading for 164.78.
See Also
- All
- Double Top
- Flag
- Head and Shoulders
- Pennant
- Rectangle
- Triangle
- Triple top
- All
- #AAPL
- #AMZN
- #Bitcoin
- #EBAY
- #FB
- #GOOG
- #INTC
- #KO
- #MA
- #MCD
- #MSFT
- #NTDOY
- #PEP
- #TSLA
- #TWTR
- AUDCAD
- AUDCHF
- AUDJPY
- AUDUSD
- EURCAD
- EURCHF
- EURGBP
- EURJPY
- EURNZD
- EURRUB
- EURUSD
- GBPAUD
- GBPCHF
- GBPJPY
- GBPUSD
- GOLD
- NZDCAD
- NZDCHF
- NZDJPY
- NZDUSD
- SILVER
- USDCAD
- USDCHF
- USDJPY
- USDRUB
- All
- M5
- M15
- M30
- H1
- D1
- All
- Buy
- Sale
- All
- 1
- 2
- 3
- 4
- 5
The Double Top pattern has been formed on #Bitcoin M5. It signals that the trend has been changed from upwards to downwards. Probably, if the base of the pattern 102532.06
The M5 and M15 time frames may have more false entry points.
Open chart in a new windowThe Double Top pattern has been formed on #Bitcoin M5. It signals that the trend has been changed from upwards to downwards. Probably, if the base of the pattern 102025.17
The M5 and M15 time frames may have more false entry points.
Open chart in a new windowThe Double Bottom pattern has been formed on #Bitcoin M5; the upper boundary is 103384.03; the lower boundary is 103150.22. The width of the pattern is 24856 points. In case
The M5 and M15 time frames may have more false entry points.
Open chart in a new window