signal strength 3 of 5

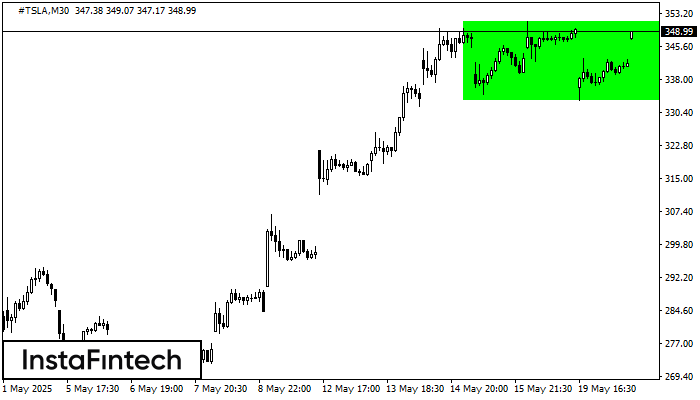
According to the chart of M30, #TSLA formed the Bullish Rectangle. The pattern indicates a trend continuation. The upper border is 351.33, the lower border is 333.21. The signal means that a long position should be opened above the upper border 351.33 of the Bullish Rectangle.
See Also
- All
- Double Top
- Flag
- Head and Shoulders
- Pennant
- Rectangle
- Triangle
- Triple top
- All
- #AAPL
- #AMZN
- #Bitcoin
- #EBAY
- #FB
- #GOOG
- #INTC
- #KO
- #MA
- #MCD
- #MSFT
- #NTDOY
- #PEP
- #TSLA
- #TWTR
- AUDCAD
- AUDCHF
- AUDJPY
- AUDUSD
- EURCAD
- EURCHF
- EURGBP
- EURJPY
- EURNZD
- EURRUB
- EURUSD
- GBPAUD
- GBPCHF
- GBPJPY
- GBPUSD
- GOLD
- NZDCAD
- NZDCHF
- NZDJPY
- NZDUSD
- SILVER
- USDCAD
- USDCHF
- USDJPY
- USDRUB
- All
- M5
- M15
- M30
- H1
- D1
- All
- Buy
- Sale
- All
- 1
- 2
- 3
- 4
- 5
The Double Bottom pattern has been formed on GBPCHF M15. Characteristics: the support level 1.1081; the resistance level 1.1094; the width of the pattern 13 points. If the resistance level
The M5 and M15 time frames may have more false entry points.
Open chart in a new windowAccording to the chart of M5, NZDUSD formed the Head and Shoulders pattern. The Head’s top is set at 0.6035 while the median line of the Neck is found
The M5 and M15 time frames may have more false entry points.
Open chart in a new windowThe Double Bottom pattern has been formed on GBPAUD M5; the upper boundary is 2.0860; the lower boundary is 2.0850. The width of the pattern is 11 points. In case
The M5 and M15 time frames may have more false entry points.
Open chart in a new window