


signal strength 3 of 5
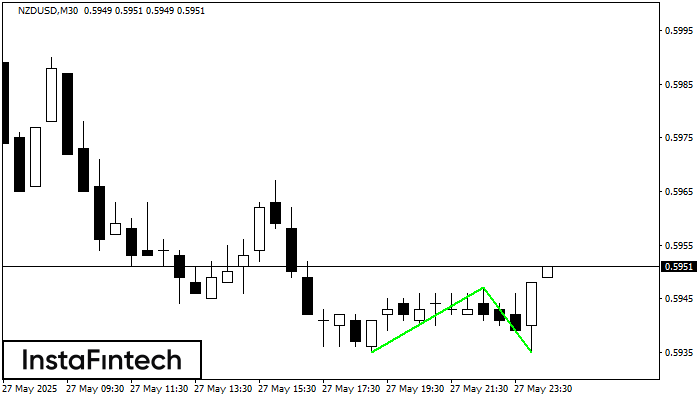
The Double Bottom pattern has been formed on NZDUSD M30; the upper boundary is 0.5947; the lower boundary is 0.5935. The width of the pattern is 12 points. In case of a break of the upper boundary 0.5947, a change in the trend can be predicted where the width of the pattern will coincide with the distance to a possible take profit level.
See Also
- All
- Double Top
- Flag
- Head and Shoulders
- Pennant
- Rectangle
- Triangle
- Triple top
- All
- #AAPL
- #AMZN
- #Bitcoin
- #EBAY
- #FB
- #GOOG
- #INTC
- #KO
- #MA
- #MCD
- #MSFT
- #NTDOY
- #PEP
- #TSLA
- #TWTR
- AUDCAD
- AUDCHF
- AUDJPY
- AUDUSD
- EURCAD
- EURCHF
- EURGBP
- EURJPY
- EURNZD
- EURRUB
- EURUSD
- GBPAUD
- GBPCHF
- GBPJPY
- GBPUSD
- GOLD
- NZDCAD
- NZDCHF
- NZDJPY
- NZDUSD
- SILVER
- USDCAD
- USDCHF
- USDJPY
- USDRUB
- All
- M5
- M15
- M30
- H1
- D1
- All
- Buy
- Sale
- All
- 1
- 2
- 3
- 4
- 5
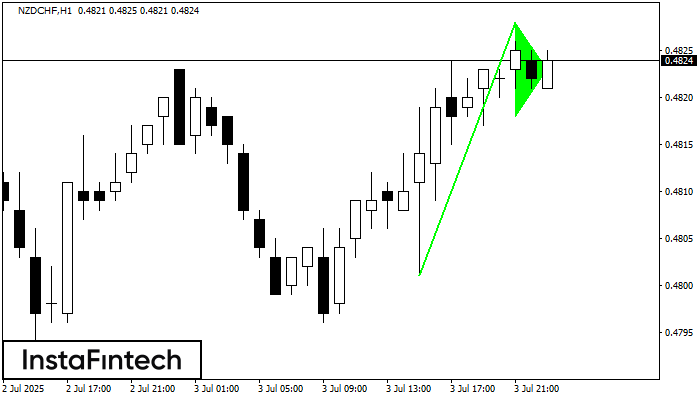
The Bullish pennant graphic pattern has formed on the NZDCHF H1 instrument. This pattern type falls under the category of continuation patterns. In this case, if the quote can breaks
Open chart in a new window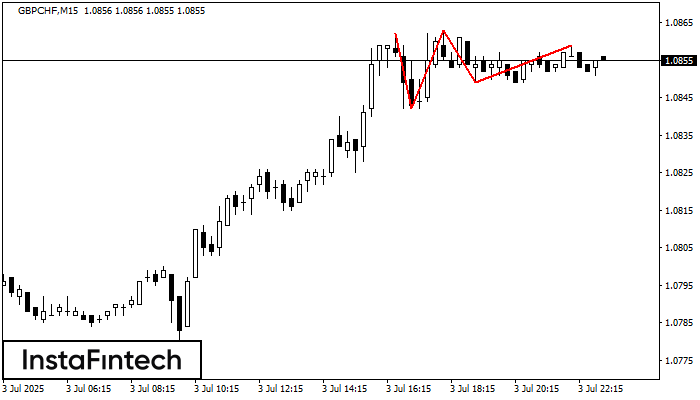
On the chart of the GBPCHF M15 trading instrument, the Triple Top pattern that signals a trend change has formed. It is possible that after formation of the third peak
The M5 and M15 time frames may have more false entry points.
Open chart in a new window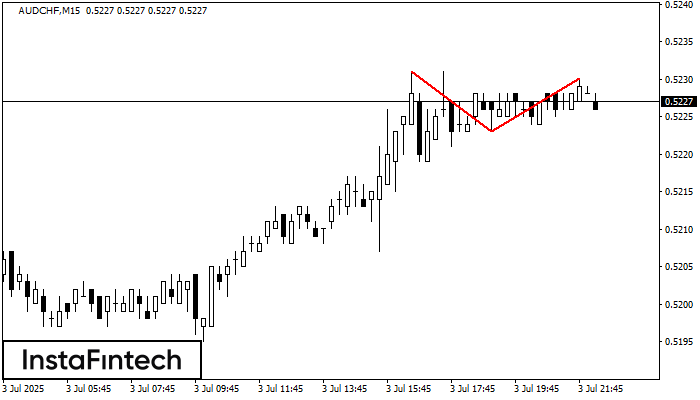
On the chart of AUDCHF M15 the Double Top reversal pattern has been formed. Characteristics: the upper boundary 0.5230; the lower boundary 0.5223; the width of the pattern 7 points
The M5 and M15 time frames may have more false entry points.
Open chart in a new window


