

signal strength 2 of 5

The Triple Bottom pattern has formed on the chart of the #Bitcoin M15 trading instrument. The pattern signals a change in the trend from downwards to upwards in the case of breakdown of 95257.28/95153.13.
The M5 and M15 time frames may have more false entry points.
See Also
- All
- Double Top
- Flag
- Head and Shoulders
- Pennant
- Rectangle
- Triangle
- Triple top
- All
- #AAPL
- #AMZN
- #Bitcoin
- #EBAY
- #FB
- #GOOG
- #INTC
- #KO
- #MA
- #MCD
- #MSFT
- #NTDOY
- #PEP
- #TSLA
- #TWTR
- AUDCAD
- AUDCHF
- AUDJPY
- AUDUSD
- EURCAD
- EURCHF
- EURGBP
- EURJPY
- EURNZD
- EURRUB
- EURUSD
- GBPAUD
- GBPCHF
- GBPJPY
- GBPUSD
- GOLD
- NZDCAD
- NZDCHF
- NZDJPY
- NZDUSD
- SILVER
- USDCAD
- USDCHF
- USDJPY
- USDRUB
- All
- M5
- M15
- M30
- H1
- D1
- All
- Buy
- Sale
- All
- 1
- 2
- 3
- 4
- 5
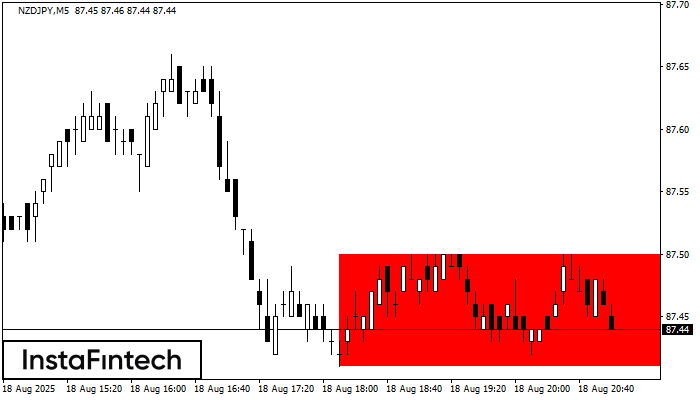
According to the chart of M5, NZDJPY formed the Bearish Rectangle. The pattern indicates a trend continuation. The upper border is 87.50, the lower border is 87.41. The signal means
The M5 and M15 time frames may have more false entry points.
Open chart in a new window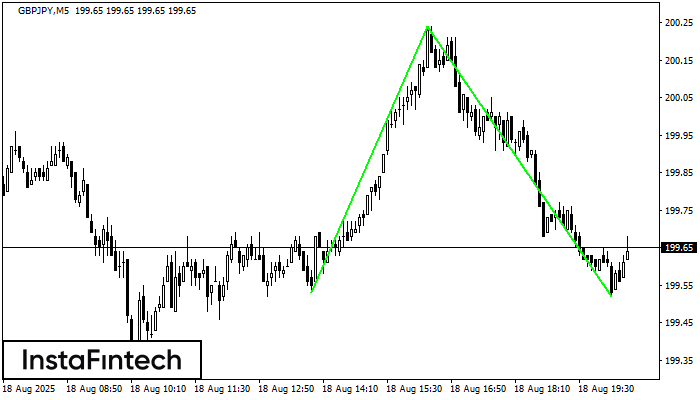
The Double Bottom pattern has been formed on GBPJPY M5; the upper boundary is 200.24; the lower boundary is 199.52. The width of the pattern is 71 points. In case
The M5 and M15 time frames may have more false entry points.
Open chart in a new window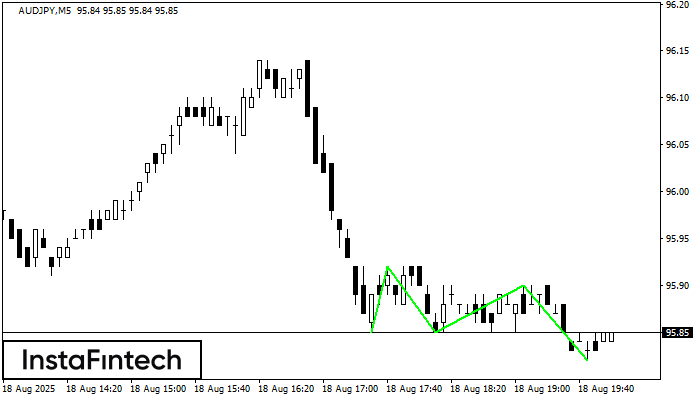
The Triple Bottom pattern has formed on the chart of AUDJPY M5. Features of the pattern: The lower line of the pattern has coordinates 95.92 with the upper limit 95.92/95.90
The M5 and M15 time frames may have more false entry points.
Open chart in a new window


