

signal strength 3 of 5
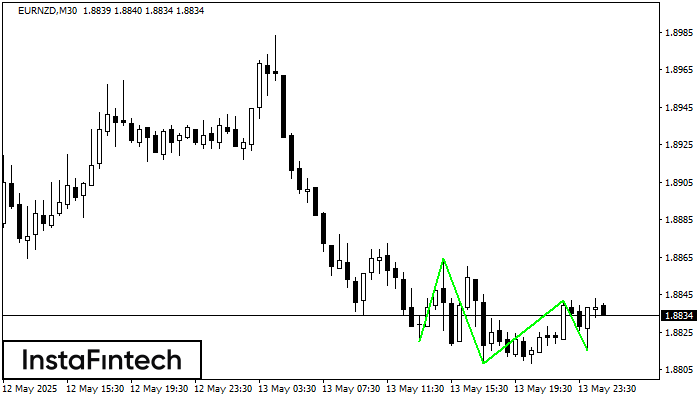
The Triple Bottom pattern has been formed on EURNZD M30. It has the following characteristics: resistance level 1.8864/1.8842; support level 1.8820/1.8815; the width is 44 points. In the event of a breakdown of the resistance level of 1.8864, the price is likely to continue an upward movement at least to 1.8838.
See Also
- All
- Double Top
- Flag
- Head and Shoulders
- Pennant
- Rectangle
- Triangle
- Triple top
- All
- #AAPL
- #AMZN
- #Bitcoin
- #EBAY
- #FB
- #GOOG
- #INTC
- #KO
- #MA
- #MCD
- #MSFT
- #NTDOY
- #PEP
- #TSLA
- #TWTR
- AUDCAD
- AUDCHF
- AUDJPY
- AUDUSD
- EURCAD
- EURCHF
- EURGBP
- EURJPY
- EURNZD
- EURRUB
- EURUSD
- GBPAUD
- GBPCHF
- GBPJPY
- GBPUSD
- GOLD
- NZDCAD
- NZDCHF
- NZDJPY
- NZDUSD
- SILVER
- USDCAD
- USDCHF
- USDJPY
- USDRUB
- All
- M5
- M15
- M30
- H1
- D1
- All
- Buy
- Sale
- All
- 1
- 2
- 3
- 4
- 5
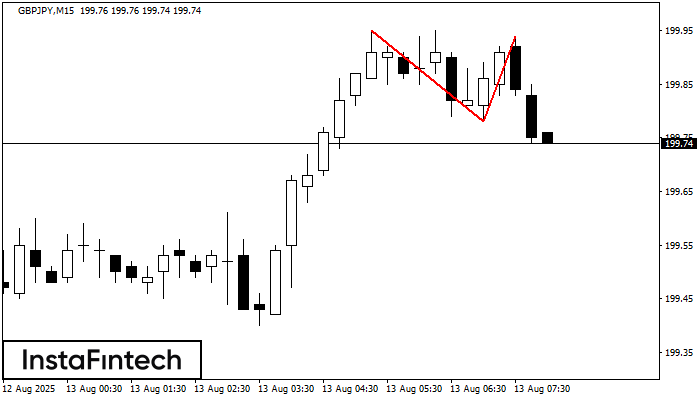
GBPJPY M15 पर डबल टॉप रीवर्सल पैटर्न बना है। विशेषताएं: ऊपरी सीमा 199.95; निचली सीमा 199.78; पैटर्न की चौड़ाई 16 पॉइंट्स है। सेल ट्रेडों को 199.78 की निचली सीमा के
M5 और M15 समय सीमा में अधिक फाल्स एंट्री पॉइंट्स हो सकते हैं।
Open chart in a new window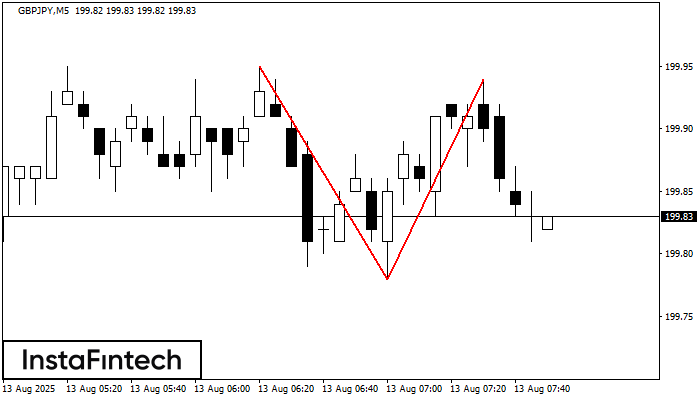
डबल टॉप पैटर्न GBPJPY M5 पर बना है। यह संकेत देता है कि प्रवृत्ति ऊपर से नीचे की ओर बदल गई है। संभवतः, यदि 199.78 पैटर्न का आधार टूट जाता
M5 और M15 समय सीमा में अधिक फाल्स एंट्री पॉइंट्स हो सकते हैं।
Open chart in a new window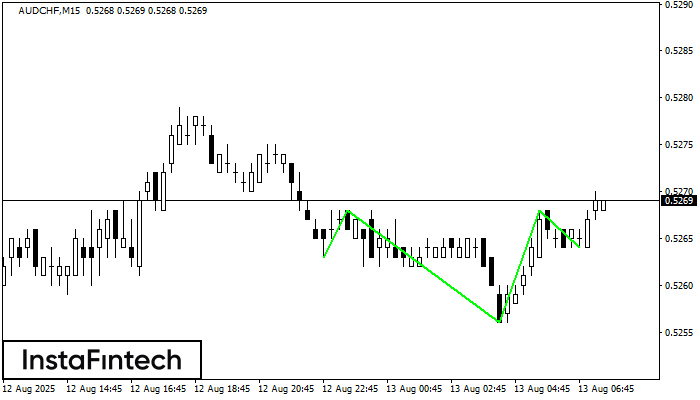
M15 के अनुसार, AUDCHF तकनीकी पैटर्न - इन्वर्स हेड एण्ड शोल्डर्स को आकार दे रहा है। यदि नेकलाइन 0.5268/0.5268 टूट जाती है, तो इंस्ट्रूमेंट के 0.5290 की ओर बढ़ने की
M5 और M15 समय सीमा में अधिक फाल्स एंट्री पॉइंट्स हो सकते हैं।
Open chart in a new window


