


signal strength 2 of 5
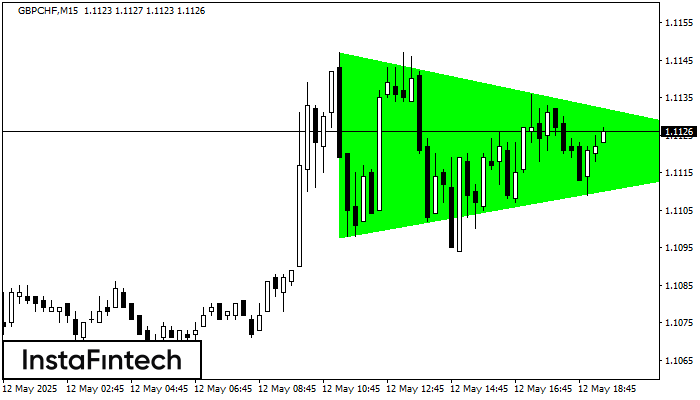
According to the chart of M15, GBPCHF formed the Bullish Symmetrical Triangle pattern, which signals the trend will continue. Description. The upper border of the pattern touches the coordinates 1.1147/1.1120 whereas the lower border goes across 1.1098/1.1120. The pattern width is measured on the chart at 49 pips. If the Bullish Symmetrical Triangle pattern is in progress during the upward trend, this indicates the current trend will go on. In case 1.1120 is broken, the price could continue its move toward 1.1142.
The M5 and M15 time frames may have more false entry points.
See Also
- All
- Double Top
- Flag
- Head and Shoulders
- Pennant
- Rectangle
- Triangle
- Triple top
- All
- #AAPL
- #AMZN
- #Bitcoin
- #EBAY
- #FB
- #GOOG
- #INTC
- #KO
- #MA
- #MCD
- #MSFT
- #NTDOY
- #PEP
- #TSLA
- #TWTR
- AUDCAD
- AUDCHF
- AUDJPY
- AUDUSD
- EURCAD
- EURCHF
- EURGBP
- EURJPY
- EURNZD
- EURRUB
- EURUSD
- GBPAUD
- GBPCHF
- GBPJPY
- GBPUSD
- GOLD
- NZDCAD
- NZDCHF
- NZDJPY
- NZDUSD
- SILVER
- USDCAD
- USDCHF
- USDJPY
- USDRUB
- All
- M5
- M15
- M30
- H1
- D1
- All
- Buy
- Sale
- All
- 1
- 2
- 3
- 4
- 5

El patrón de reversión Doble Techo ha sido formado en #Bitcoin M30. Características: el límite superior 105283.16; el límite inferior 103816.55; el ancho del patrón es 147353 puntos. Es mejor
Open chart in a new window
En el gráfico de USDCAD M15 el patrón de reversión Doble Techo ha sido formado. Características: límite superior 1.3702; límite inferior 1.3668; el ancho del patrón 34 puntos. La señal
Los marcos de tiempo M5 y M15 pueden tener más puntos de entrada falsos.
Open chart in a new window
Según el gráfico de M15, el AUDJPY formó el patrón Triángulo Simétrico Alcista. El límite inferior del patrón toca las coordenadas 93.96/94.02 donde el límite superior cruza 94.07/94.02
Los marcos de tiempo M5 y M15 pueden tener más puntos de entrada falsos.
Open chart in a new window


