


signal strength 1 of 5
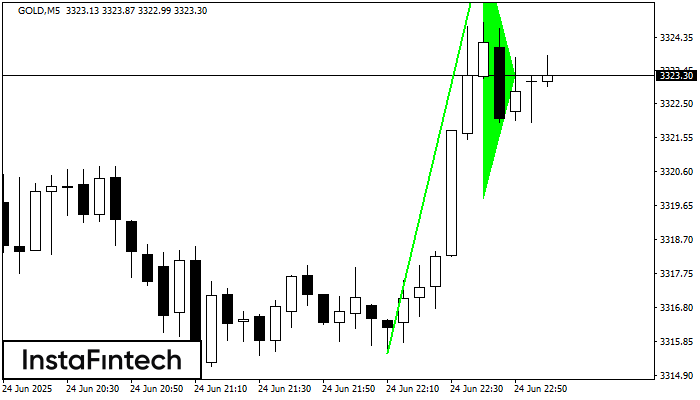
The Bullish pennant signal – Trading instrument GOLD M5, continuation pattern. Forecast: it is possible to set up a buy position above the pattern’s high of 3326.76, with the prospect of the next move being a projection of the flagpole height.
The M5 and M15 time frames may have more false entry points.
See Also
- All
- Double Top
- Flag
- Head and Shoulders
- Pennant
- Rectangle
- Triangle
- Triple top
- All
- #AAPL
- #AMZN
- #Bitcoin
- #EBAY
- #FB
- #GOOG
- #INTC
- #KO
- #MA
- #MCD
- #MSFT
- #NTDOY
- #PEP
- #TSLA
- #TWTR
- AUDCAD
- AUDCHF
- AUDJPY
- AUDUSD
- EURCAD
- EURCHF
- EURGBP
- EURJPY
- EURNZD
- EURRUB
- EURUSD
- GBPAUD
- GBPCHF
- GBPJPY
- GBPUSD
- GOLD
- NZDCAD
- NZDCHF
- NZDJPY
- NZDUSD
- SILVER
- USDCAD
- USDCHF
- USDJPY
- USDRUB
- All
- M5
- M15
- M30
- H1
- D1
- All
- Buy
- Sale
- All
- 1
- 2
- 3
- 4
- 5
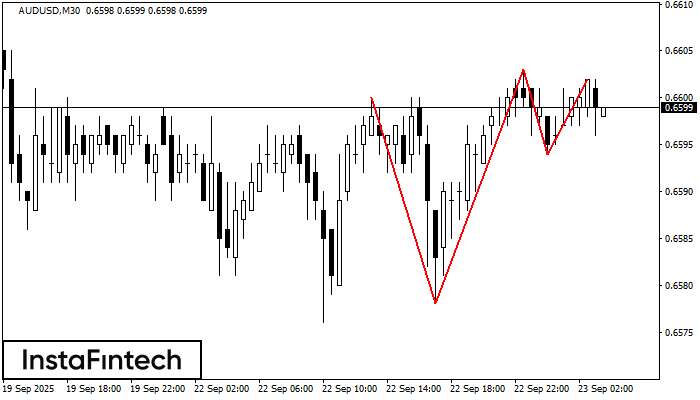
On the chart of the AUDUSD M30 trading instrument, the Triple Top pattern that signals a trend change has formed. It is possible that after formation of the third peak
Open chart in a new window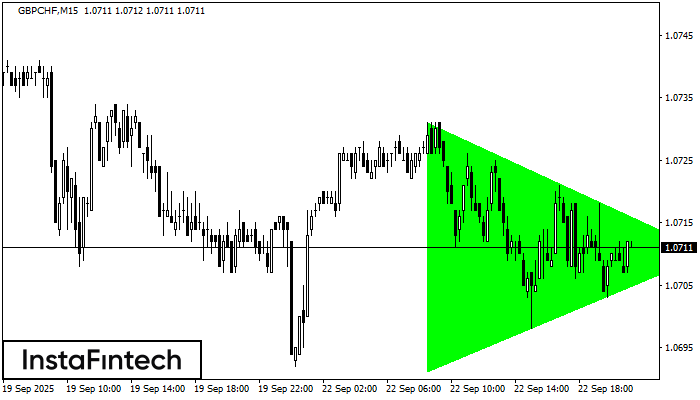
According to the chart of M15, GBPCHF formed the Bullish Symmetrical Triangle pattern. Description: This is the pattern of a trend continuation. 1.0731 and 1.0691 are the coordinates
The M5 and M15 time frames may have more false entry points.
Open chart in a new window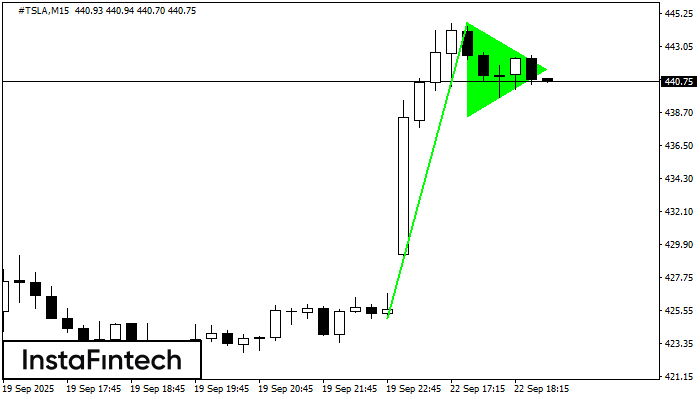
The Bullish pennant pattern is formed on the #TSLA M15 chart. It is a type of the continuation pattern. Supposedly, in case the price is fixed above the pennant’s high
The M5 and M15 time frames may have more false entry points.
Open chart in a new window


