


signal strength 2 of 5
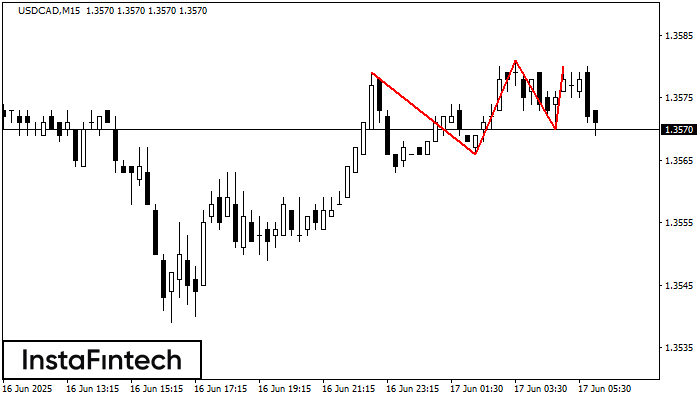
The Triple Top pattern has formed on the chart of the USDCAD M15. Features of the pattern: borders have an ascending angle; the lower line of the pattern has the coordinates 1.3566/1.3570 with the upper limit 1.3579/1.3580; the projection of the width is 13 points. The formation of the Triple Top figure most likely indicates a change in the trend from upward to downward. This means that in the event of a breakdown of the support level of 1.3566, the price is most likely to continue the downward movement.
The M5 and M15 time frames may have more false entry points.
See Also
- All
- Double Top
- Flag
- Head and Shoulders
- Pennant
- Rectangle
- Triangle
- Triple top
- All
- #AAPL
- #AMZN
- #Bitcoin
- #EBAY
- #FB
- #GOOG
- #INTC
- #KO
- #MA
- #MCD
- #MSFT
- #NTDOY
- #PEP
- #TSLA
- #TWTR
- AUDCAD
- AUDCHF
- AUDJPY
- AUDUSD
- EURCAD
- EURCHF
- EURGBP
- EURJPY
- EURNZD
- EURRUB
- EURUSD
- GBPAUD
- GBPCHF
- GBPJPY
- GBPUSD
- GOLD
- NZDCAD
- NZDCHF
- NZDJPY
- NZDUSD
- SILVER
- USDCAD
- USDCHF
- USDJPY
- USDRUB
- All
- M5
- M15
- M30
- H1
- D1
- All
- Buy
- Sale
- All
- 1
- 2
- 3
- 4
- 5
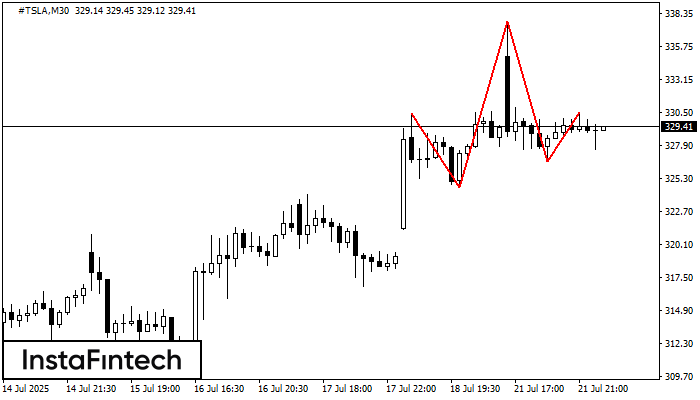
#TSLA M30 membentuk corak Head dan Shoulders dengan ciri-ciri berikut: Bahagian atas Head adalah 337.71, garisan Neck dan sudut menaik berada pada 324.60/326.66. Pembentukan corak ini boleh membawa perubahan dalam
Open chart in a new window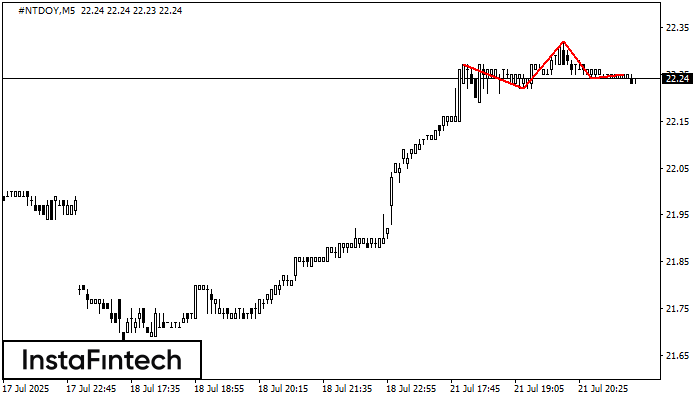
Corak teknikal yang dipanggil Head dan Shoulders telah muncul pada carta #NTDOY M5. Terdapat alasan yang berat untuk menunjukkan bahawa harga akan mengatasi garisan Neck 22.22/22.24 selepas Shoulder kanan telah
Carta masa M5 dan M15 mungkin mempunyai lebih banyak titik kemasukan palsu.
Open chart in a new window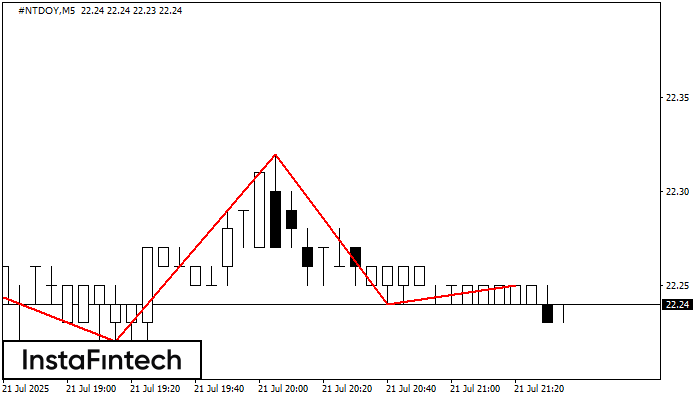
#NTDOY M5 membentuk corak Head dan Shoulders dengan ciri-ciri berikut: Bahagian atas Head adalah 22.32, garisan Neck dan sudut menaik berada pada 22.22/22.24. Pembentukan corak ini boleh membawa perubahan dalam
Carta masa M5 dan M15 mungkin mempunyai lebih banyak titik kemasukan palsu.
Open chart in a new window


