


signal strength 1 of 5
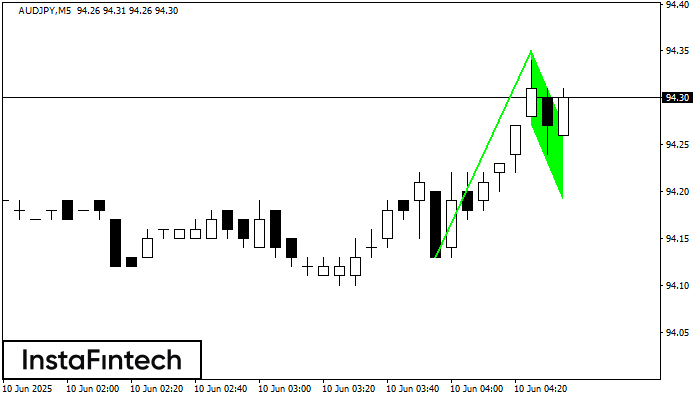
The Bullish Flag pattern has been formed on AUDJPY at M5. The lower boundary of the pattern is located at 94.27/94.19, while the higher boundary lies at 94.35/94.27. The projection of the flagpole is 22 points. This formation signals that the upward trend is most likely to continue. Therefore, if the level of 94.35 is broken, the price will move further upwards.
The M5 and M15 time frames may have more false entry points.
See Also
- All
- Double Top
- Flag
- Head and Shoulders
- Pennant
- Rectangle
- Triangle
- Triple top
- All
- #AAPL
- #AMZN
- #Bitcoin
- #EBAY
- #FB
- #GOOG
- #INTC
- #KO
- #MA
- #MCD
- #MSFT
- #NTDOY
- #PEP
- #TSLA
- #TWTR
- AUDCAD
- AUDCHF
- AUDJPY
- AUDUSD
- EURCAD
- EURCHF
- EURGBP
- EURJPY
- EURNZD
- EURRUB
- EURUSD
- GBPAUD
- GBPCHF
- GBPJPY
- GBPUSD
- GOLD
- NZDCAD
- NZDCHF
- NZDJPY
- NZDUSD
- SILVER
- USDCAD
- USDCHF
- USDJPY
- USDRUB
- All
- M5
- M15
- M30
- H1
- D1
- All
- Buy
- Sale
- All
- 1
- 2
- 3
- 4
- 5
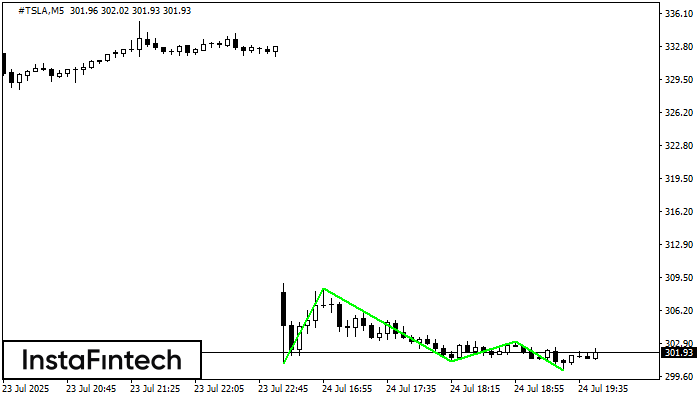
The Triple Bottom pattern has been formed on #TSLA M5. It has the following characteristics: resistance level 308.42/303.11; support level 300.82/300.19; the width is 760 points. In the event
The M5 and M15 time frames may have more false entry points.
Open chart in a new window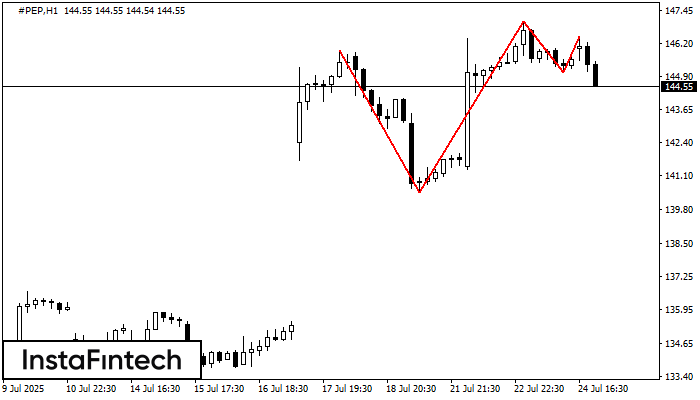
The Triple Top pattern has formed on the chart of the #PEP H1. Features of the pattern: borders have an ascending angle; the lower line of the pattern
Open chart in a new window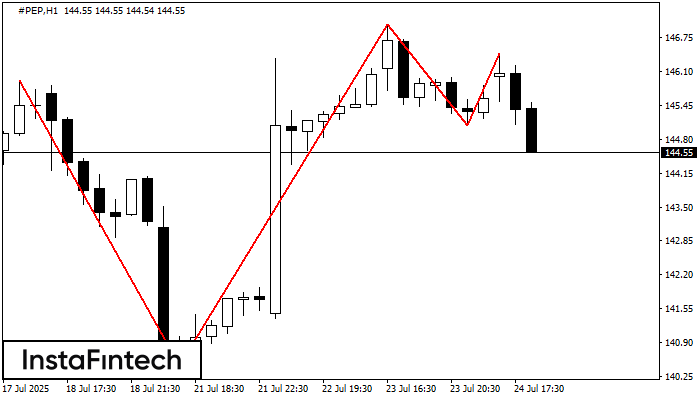
On the chart of the #PEP H1 trading instrument, the Triple Top pattern that signals a trend change has formed. It is possible that after formation of the third peak
Open chart in a new window


