

signal strength 1 of 5
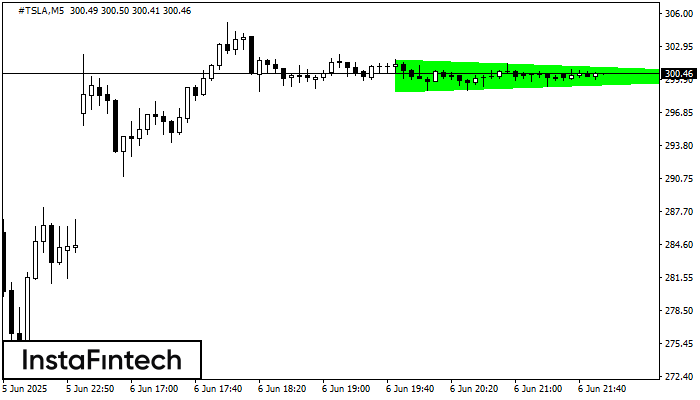
According to the chart of M5, #TSLA formed the Bullish Symmetrical Triangle pattern, which signals the trend will continue. Description. The upper border of the pattern touches the coordinates 301.78/300.20 whereas the lower border goes across 298.80/300.20. The pattern width is measured on the chart at 298 pips. If the Bullish Symmetrical Triangle pattern is in progress during the upward trend, this indicates the current trend will go on. In case 300.20 is broken, the price could continue its move toward 300.35.
The M5 and M15 time frames may have more false entry points.
See Also
- All
- Double Top
- Flag
- Head and Shoulders
- Pennant
- Rectangle
- Triangle
- Triple top
- All
- #AAPL
- #AMZN
- #Bitcoin
- #EBAY
- #FB
- #GOOG
- #INTC
- #KO
- #MA
- #MCD
- #MSFT
- #NTDOY
- #PEP
- #TSLA
- #TWTR
- AUDCAD
- AUDCHF
- AUDJPY
- AUDUSD
- EURCAD
- EURCHF
- EURGBP
- EURJPY
- EURNZD
- EURRUB
- EURUSD
- GBPAUD
- GBPCHF
- GBPJPY
- GBPUSD
- GOLD
- NZDCAD
- NZDCHF
- NZDJPY
- NZDUSD
- SILVER
- USDCAD
- USDCHF
- USDJPY
- USDRUB
- All
- M5
- M15
- M30
- H1
- D1
- All
- Buy
- Sale
- All
- 1
- 2
- 3
- 4
- 5
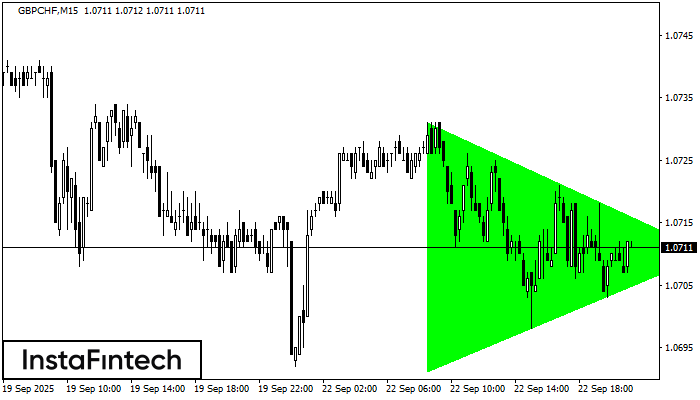
Theo biểu đồ của M15, GBPCHF đã hình thành mô hình Tam giác Cân Tăng. Mô tả: Đây là mô hình của sự tiếp tục xu hướng. 1.0731 và 1.0691
Khung thời gian M5 và M15 có thể có nhiều điểm vào lệnh sai hơn.
Open chart in a new window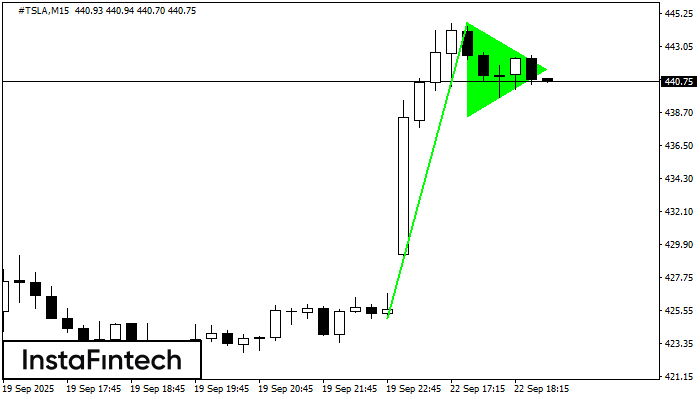
Mô hình Cờ hiệu tăng được hình thành trên biểu đồ #TSLA M15. Nó là một loại của mô hình tiếp tục. Giả sử, trong trường hợp giá được
Khung thời gian M5 và M15 có thể có nhiều điểm vào lệnh sai hơn.
Open chart in a new window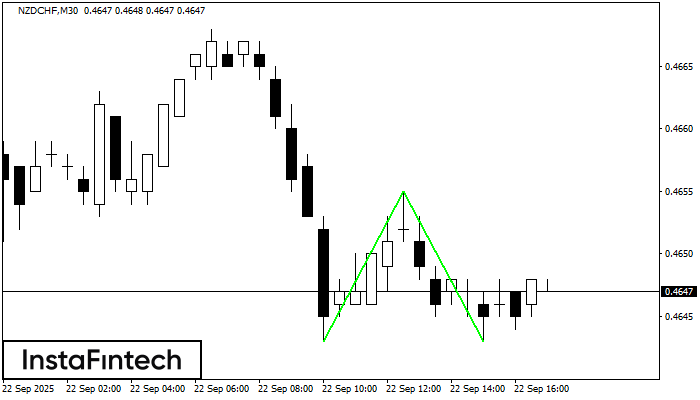
Mô hình Đáy đôi đã được hình thành trên NZDCHF M30; đường viền trên là 0.4655; đường viền dưới là 0.4643. Độ rộng của mô hình là 12 điểm. Trong
Open chart in a new window


