

signal strength 1 of 5
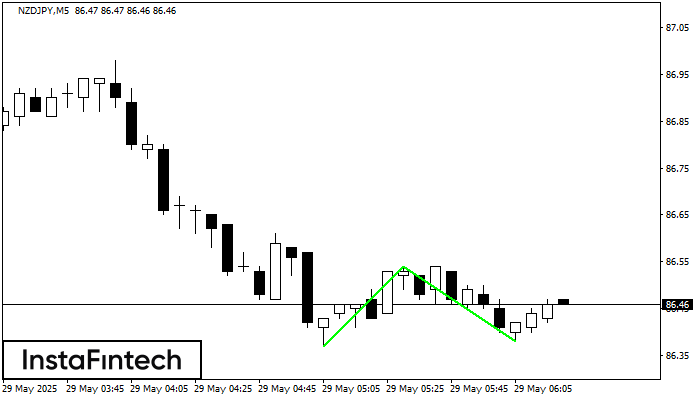
The Double Bottom pattern has been formed on NZDJPY M5. Characteristics: the support level 86.37; the resistance level 86.54; the width of the pattern 17 points. If the resistance level is broken, a change in the trend can be predicted with the first target point lying at the distance of 16 points.
The M5 and M15 time frames may have more false entry points.
- All
- Double Top
- Flag
- Head and Shoulders
- Pennant
- Rectangle
- Triangle
- Triple top
- All
- #AAPL
- #AMZN
- #Bitcoin
- #EBAY
- #FB
- #GOOG
- #INTC
- #KO
- #MA
- #MCD
- #MSFT
- #NTDOY
- #PEP
- #TSLA
- #TWTR
- AUDCAD
- AUDCHF
- AUDJPY
- AUDUSD
- EURCAD
- EURCHF
- EURGBP
- EURJPY
- EURNZD
- EURRUB
- EURUSD
- GBPAUD
- GBPCHF
- GBPJPY
- GBPUSD
- GOLD
- NZDCAD
- NZDCHF
- NZDJPY
- NZDUSD
- SILVER
- USDCAD
- USDCHF
- USDJPY
- USDRUB
- All
- M5
- M15
- M30
- H1
- D1
- All
- Buy
- Sale
- All
- 1
- 2
- 3
- 4
- 5
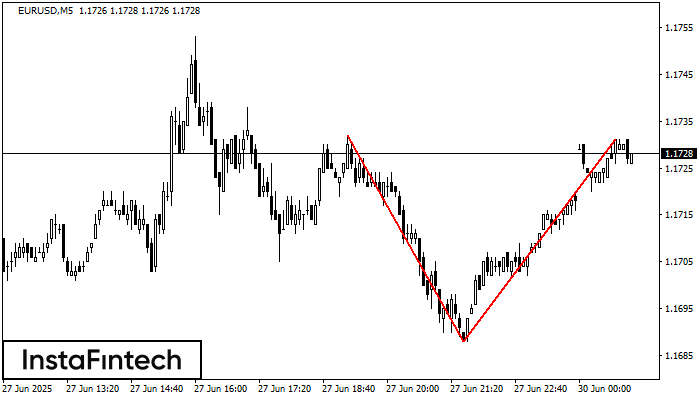
On the chart of EURUSD M5 the Double Top reversal pattern has been formed. Characteristics: the upper boundary 1.1731; the lower boundary 1.1688; the width of the pattern 43 points
The M5 and M15 time frames may have more false entry points.
Open chart in a new window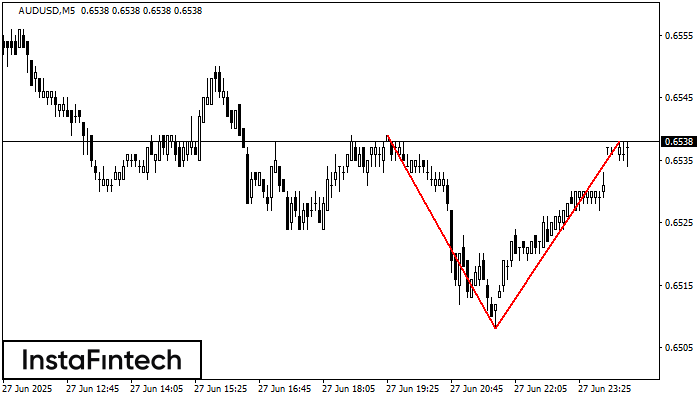
On the chart of AUDUSD M5 the Double Top reversal pattern has been formed. Characteristics: the upper boundary 0.6538; the lower boundary 0.6508; the width of the pattern 30 points
The M5 and M15 time frames may have more false entry points.
Open chart in a new window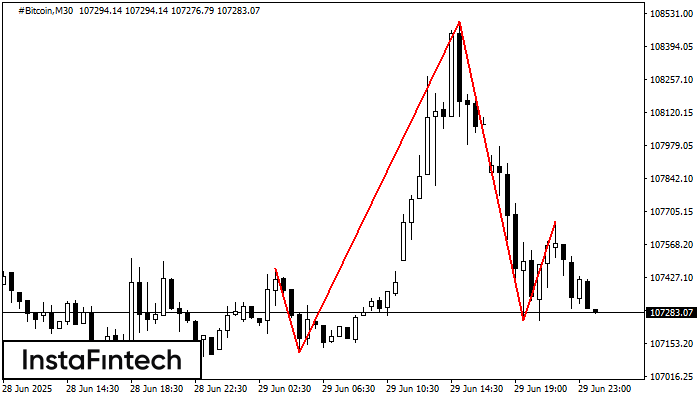
The #Bitcoin M30 formed the Head and Shoulders pattern with the following features: The Head’s top is at 108499.13, the Neckline and the upward angle are at 107112.85/107248.11. The formation
Open chart in a new window


