


signal strength 1 of 5

On the chart of the GOLD M5 trading instrument, the Triple Top pattern that signals a trend change has formed. It is possible that after formation of the third peak, the price will try to break through the resistance level 3381.38, where we advise to open a trading position for sale. Take profit is the projection of the pattern’s width, which is 1420 points.
The M5 and M15 time frames may have more false entry points.
See Also
- All
- Double Top
- Flag
- Head and Shoulders
- Pennant
- Rectangle
- Triangle
- Triple top
- All
- #AAPL
- #AMZN
- #Bitcoin
- #EBAY
- #FB
- #GOOG
- #INTC
- #KO
- #MA
- #MCD
- #MSFT
- #NTDOY
- #PEP
- #TSLA
- #TWTR
- AUDCAD
- AUDCHF
- AUDJPY
- AUDUSD
- EURCAD
- EURCHF
- EURGBP
- EURJPY
- EURNZD
- EURRUB
- EURUSD
- GBPAUD
- GBPCHF
- GBPJPY
- GBPUSD
- GOLD
- NZDCAD
- NZDCHF
- NZDJPY
- NZDUSD
- SILVER
- USDCAD
- USDCHF
- USDJPY
- USDRUB
- All
- M5
- M15
- M30
- H1
- D1
- All
- Buy
- Sale
- All
- 1
- 2
- 3
- 4
- 5
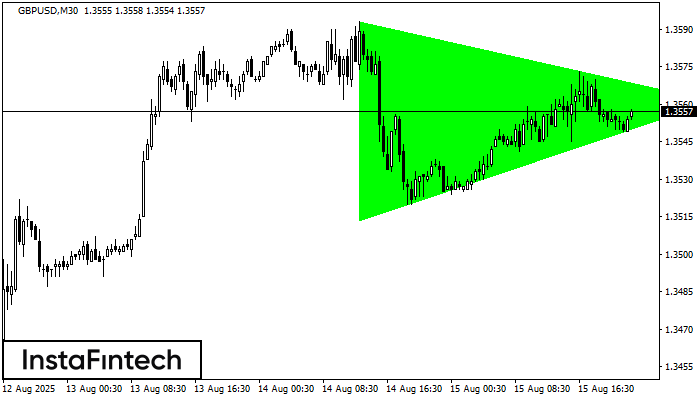
По GBPUSD на M30 сформировалась фигура «Бычий симметричный треугольник», которая сигнализирует нам о продолжении тенденции. Характеристика: Верхняя граница фигуры имеет координаты 1.3593/1.3561; Нижняя граница 1.3514/1.3561; Проекция ширины фигуры 79 пунктов
Открыть график инструмента в новом окне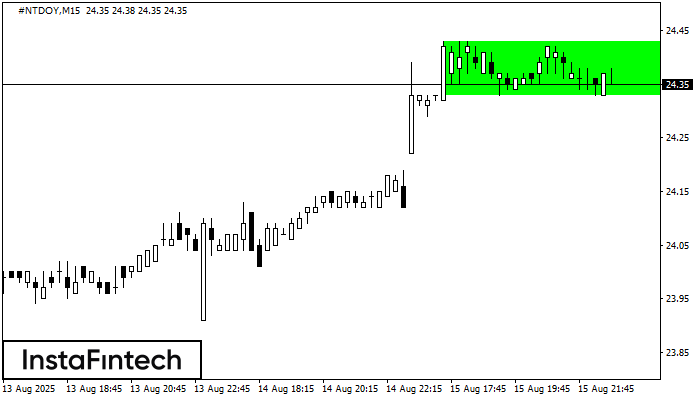
Сформирована фигура «Прямоугольник» на графике #NTDOY M15. Тип фигуры: Продолжение тренда; Границы: Верхняя 24.43, Нижняя 24.33; Сигнал: позицию на покупку следует открывать выше верхней границы прямоугольника 24.43
Таймфреймы М5 и М15 могут иметь больше ложных точек входа.
Открыть график инструмента в новом окне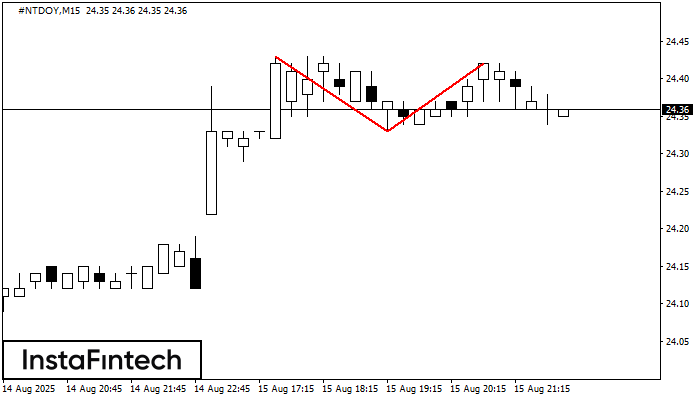
На торговом графике #NTDOY M15 сформировалась разворотная фигура «Двойная вершина». Характеристика: Верхняя граница 24.42; Нижняя граница 24.33; Ширина фигуры 9 пунктов. Сигнал: Пробой нижней границы 24.33 приведет к дальнейшему нисходящему
Таймфреймы М5 и М15 могут иметь больше ложных точек входа.
Открыть график инструмента в новом окне


