

signal strength 2 of 5
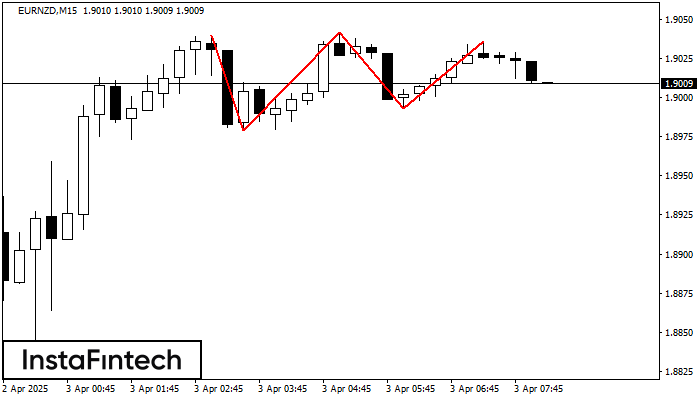
On the chart of the EURNZD M15 trading instrument, the Triple Top pattern that signals a trend change has formed. It is possible that after formation of the third peak, the price will try to break through the resistance level 1.8979, where we advise to open a trading position for sale. Take profit is the projection of the pattern’s width, which is 61 points.
The M5 and M15 time frames may have more false entry points.
See Also
- All
- Double Top
- Flag
- Head and Shoulders
- Pennant
- Rectangle
- Triangle
- Triple top
- All
- #AAPL
- #AMZN
- #Bitcoin
- #EBAY
- #FB
- #GOOG
- #INTC
- #KO
- #MA
- #MCD
- #MSFT
- #NTDOY
- #PEP
- #TSLA
- #TWTR
- AUDCAD
- AUDCHF
- AUDJPY
- AUDUSD
- EURCAD
- EURCHF
- EURGBP
- EURJPY
- EURNZD
- EURRUB
- EURUSD
- GBPAUD
- GBPCHF
- GBPJPY
- GBPUSD
- GOLD
- NZDCAD
- NZDCHF
- NZDJPY
- NZDUSD
- SILVER
- USDCAD
- USDCHF
- USDJPY
- USDRUB
- All
- M5
- M15
- M30
- H1
- D1
- All
- Buy
- Sale
- All
- 1
- 2
- 3
- 4
- 5
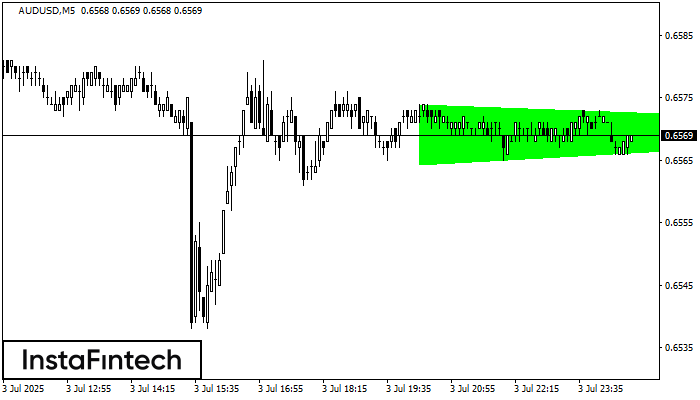
M5 চার্ট অনুসারে, AUDUSD বুলিশ সিমেট্রিকাল ট্রায়াঙ্গেল প্যাটার্ন গঠন করেছে, যা চলমান প্রবণতা অব্যাহত থাকবে বলে ইঙ্গিত দিচ্ছে। বর্ণনা: প্যাটার্নের উপরের সীমানা 0.6574/0.6570-এর কোঅর্ডিনেটগুলো স্পর্শ করেছে যেখানে নীচের সীমানা 0.6564/0.6570
M5 এবং M15 টাইম ফ্রেমে আরও ভুল এন্ট্রি পয়েন্ট থাকতে পারে।
Open chart in a new window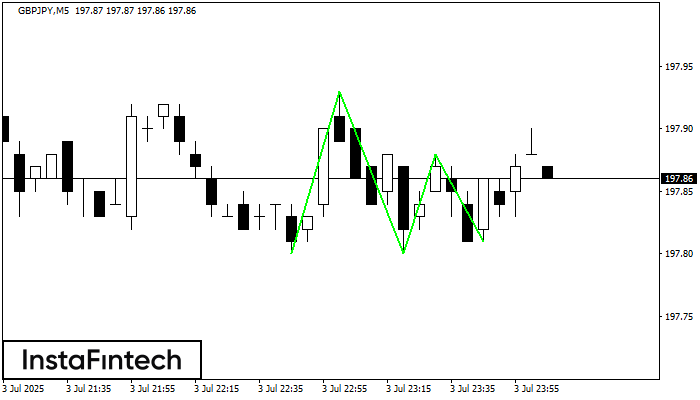
M5 চার্টে, GBPJPY ট্রেডিং ইন্সট্রুমেন্টের ট্রিপল বটম প্যাটার্ন গঠিত হয়েছে। 197.93/197.88 ব্রেকডাউনের ক্ষেত্রে এই প্যাটার্ন নিম্নমুখী প্রবণতা থেকে ঊর্ধ্বমুখী প্রবণতায় পরিবর্তনের সংকেত দেয়৷
M5 এবং M15 টাইম ফ্রেমে আরও ভুল এন্ট্রি পয়েন্ট থাকতে পারে।
Open chart in a new window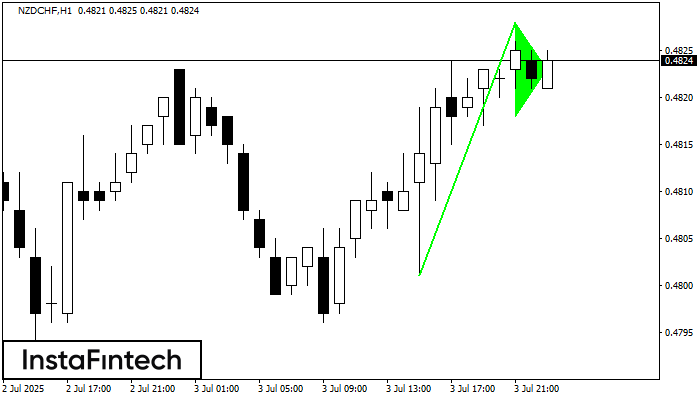
H1 চার্টে NZDCHF ইন্সট্রুমেন্টে বুলিশ পেন্যান্ট গ্রাফিক প্যাটার্ন গঠিত হয়েছে। এই প্যাটার্নের ধরনটি ধারাবাহিকতা প্যাটার্নের বিভাগে পড়ে। এই ক্ষেত্রে, যদি মূল্য সর্বোচ্চ স্তর ভেদ করতে পারে, তাহলে 0.4868 -এর স্তরে
Open chart in a new window


