


signal strength 2 of 5
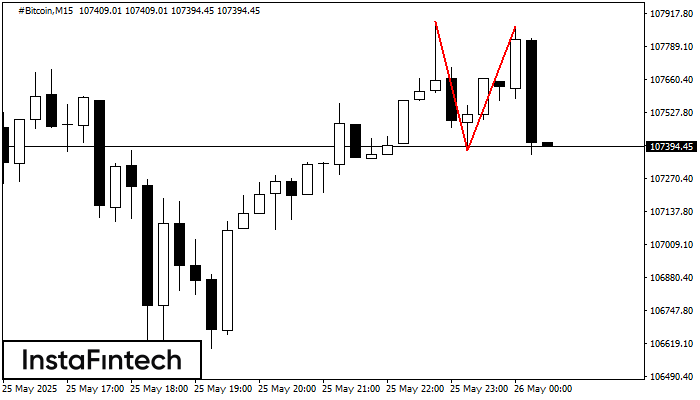
The Double Top pattern has been formed on #Bitcoin M15. It signals that the trend has been changed from upwards to downwards. Probably, if the base of the pattern 107378.53 is broken, the downward movement will continue.
The M5 and M15 time frames may have more false entry points.
- All
- Double Top
- Flag
- Head and Shoulders
- Pennant
- Rectangle
- Triangle
- Triple top
- All
- #AAPL
- #AMZN
- #Bitcoin
- #EBAY
- #FB
- #GOOG
- #INTC
- #KO
- #MA
- #MCD
- #MSFT
- #NTDOY
- #PEP
- #TSLA
- #TWTR
- AUDCAD
- AUDCHF
- AUDJPY
- AUDUSD
- EURCAD
- EURCHF
- EURGBP
- EURJPY
- EURNZD
- EURRUB
- EURUSD
- GBPAUD
- GBPCHF
- GBPJPY
- GBPUSD
- GOLD
- NZDCAD
- NZDCHF
- NZDJPY
- NZDUSD
- SILVER
- USDCAD
- USDCHF
- USDJPY
- USDRUB
- All
- M5
- M15
- M30
- H1
- D1
- All
- Buy
- Sale
- All
- 1
- 2
- 3
- 4
- 5
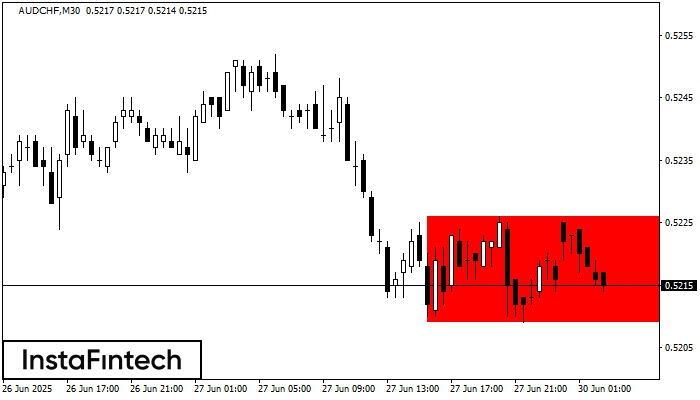
According to the chart of M30, AUDCHF formed the Bearish Rectangle. The pattern indicates a trend continuation. The upper border is 0.5226, the lower border is 0.5209. The signal means
Open chart in a new window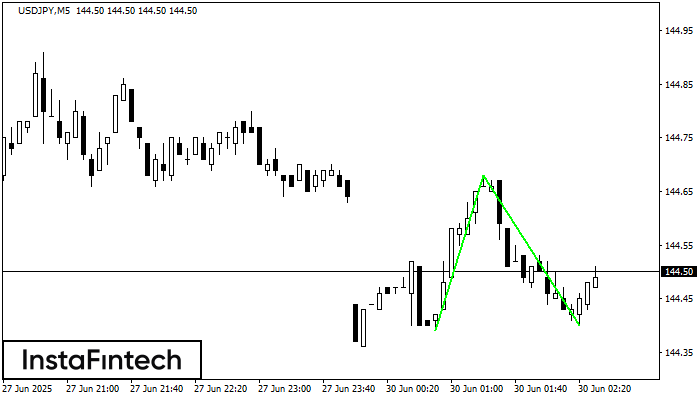
The Double Bottom pattern has been formed on USDJPY M5; the upper boundary is 144.68; the lower boundary is 144.40. The width of the pattern is 29 points. In case
The M5 and M15 time frames may have more false entry points.
Open chart in a new window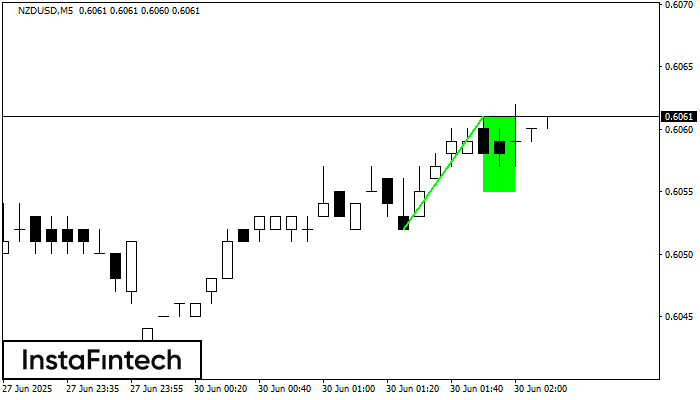
The Bullish Flag pattern has been formed on NZDUSD at M5. The lower boundary of the pattern is located at 0.6055/0.6055, while the higher boundary lies at 0.6061/0.6061. The projection
The M5 and M15 time frames may have more false entry points.
Open chart in a new window


