

signal strength 4 of 5
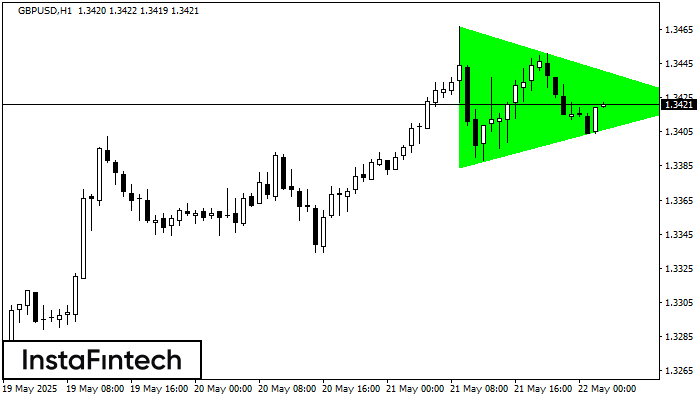
According to the chart of H1, GBPUSD formed the Bullish Symmetrical Triangle pattern. Description: This is the pattern of a trend continuation. 1.3467 and 1.3384 are the coordinates of the upper and lower borders respectively. The pattern width is measured on the chart at 83 pips. Outlook: If the upper border 1.3467 is broken, the price is likely to continue its move by 1.3462.
See Also
- All
- Double Top
- Flag
- Head and Shoulders
- Pennant
- Rectangle
- Triangle
- Triple top
- All
- #AAPL
- #AMZN
- #Bitcoin
- #EBAY
- #FB
- #GOOG
- #INTC
- #KO
- #MA
- #MCD
- #MSFT
- #NTDOY
- #PEP
- #TSLA
- #TWTR
- AUDCAD
- AUDCHF
- AUDJPY
- AUDUSD
- EURCAD
- EURCHF
- EURGBP
- EURJPY
- EURNZD
- EURRUB
- EURUSD
- GBPAUD
- GBPCHF
- GBPJPY
- GBPUSD
- GOLD
- NZDCAD
- NZDCHF
- NZDJPY
- NZDUSD
- SILVER
- USDCAD
- USDCHF
- USDJPY
- USDRUB
- All
- M5
- M15
- M30
- H1
- D1
- All
- Buy
- Sale
- All
- 1
- 2
- 3
- 4
- 5
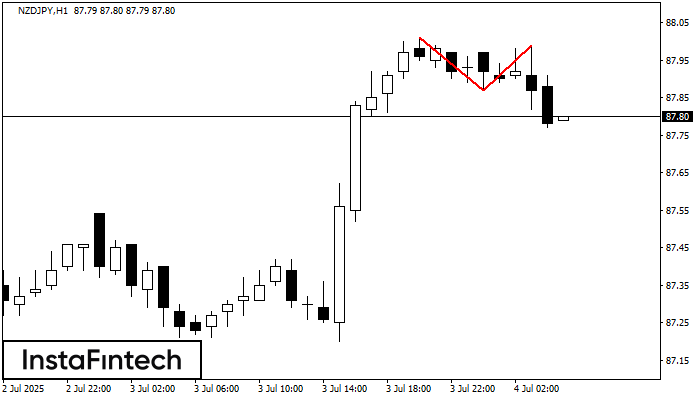
On the chart of NZDJPY H1 the Double Top reversal pattern has been formed. Characteristics: the upper boundary 87.99; the lower boundary 87.87; the width of the pattern 12 points
Open chart in a new window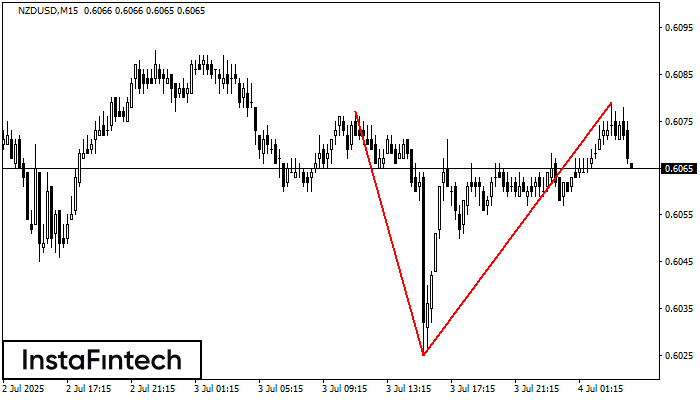
The Double Top pattern has been formed on NZDUSD M15. It signals that the trend has been changed from upwards to downwards. Probably, if the base of the pattern 0.6025
The M5 and M15 time frames may have more false entry points.
Open chart in a new window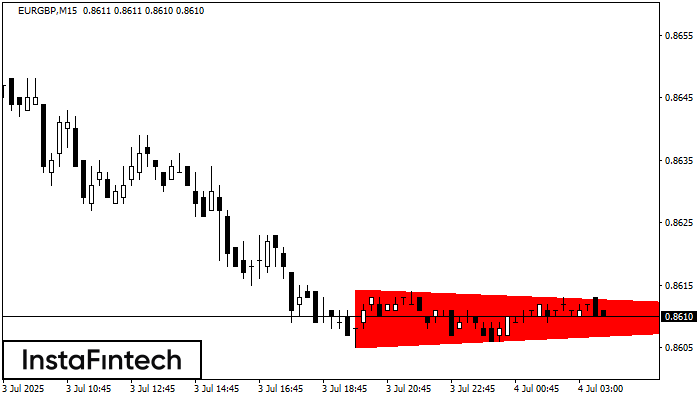
According to the chart of M15, EURGBP formed the Bearish Symmetrical Triangle pattern. Description: The lower border is 0.8605/0.8610 and upper border is 0.8614/0.8610. The pattern width is measured
The M5 and M15 time frames may have more false entry points.
Open chart in a new window


