

signal strength 1 of 5
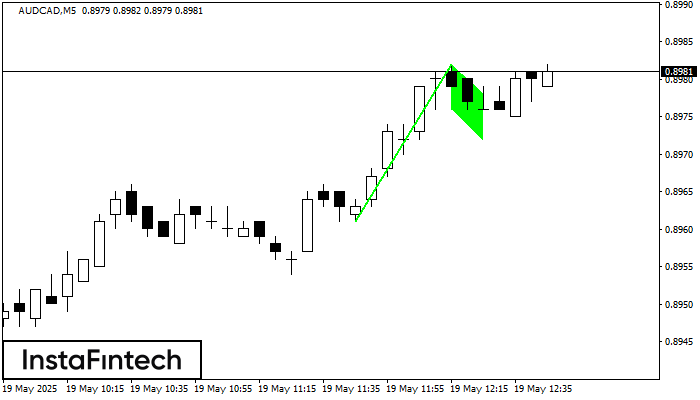
The Bullish Flag pattern has been formed on AUDCAD at M5. The lower boundary of the pattern is located at 0.8976/0.8972, while the higher boundary lies at 0.8982/0.8978. The projection of the flagpole is 21 points. This formation signals that the upward trend is most likely to continue. Therefore, if the level of 0.8982 is broken, the price will move further upwards.
The M5 and M15 time frames may have more false entry points.
See Also
- All
- Double Top
- Flag
- Head and Shoulders
- Pennant
- Rectangle
- Triangle
- Triple top
- All
- #AAPL
- #AMZN
- #Bitcoin
- #EBAY
- #FB
- #GOOG
- #INTC
- #KO
- #MA
- #MCD
- #MSFT
- #NTDOY
- #PEP
- #TSLA
- #TWTR
- AUDCAD
- AUDCHF
- AUDJPY
- AUDUSD
- EURCAD
- EURCHF
- EURGBP
- EURJPY
- EURNZD
- EURRUB
- EURUSD
- GBPAUD
- GBPCHF
- GBPJPY
- GBPUSD
- GOLD
- NZDCAD
- NZDCHF
- NZDJPY
- NZDUSD
- SILVER
- USDCAD
- USDCHF
- USDJPY
- USDRUB
- All
- M5
- M15
- M30
- H1
- D1
- All
- Buy
- Sale
- All
- 1
- 2
- 3
- 4
- 5
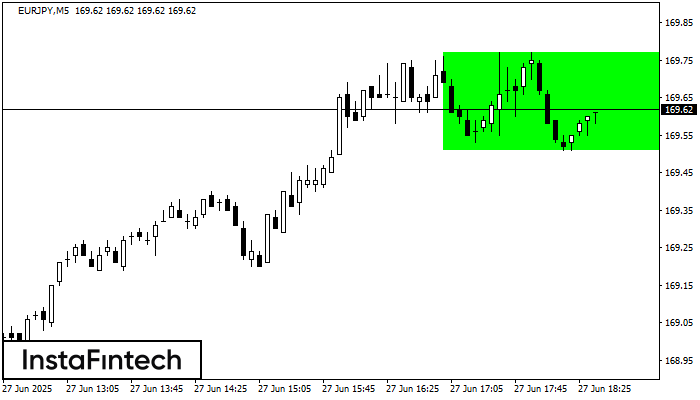
According to the chart of M5, EURJPY formed the Bullish Rectangle. The pattern indicates a trend continuation. The upper border is 169.77, the lower border is 169.51. The signal means
The M5 and M15 time frames may have more false entry points.
Open chart in a new window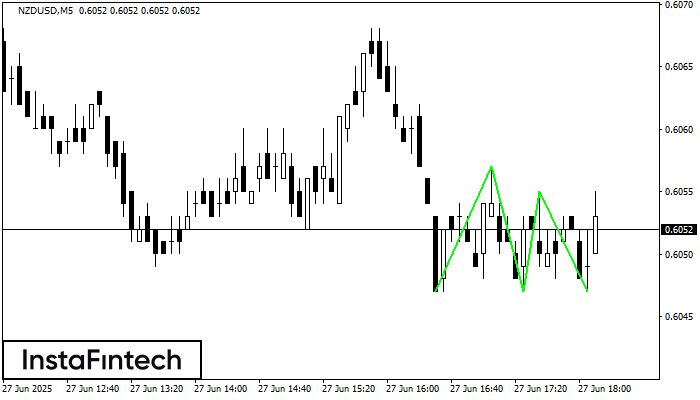
The Triple Bottom pattern has formed on the chart of the NZDUSD M5 trading instrument. The pattern signals a change in the trend from downwards to upwards in the case
The M5 and M15 time frames may have more false entry points.
Open chart in a new window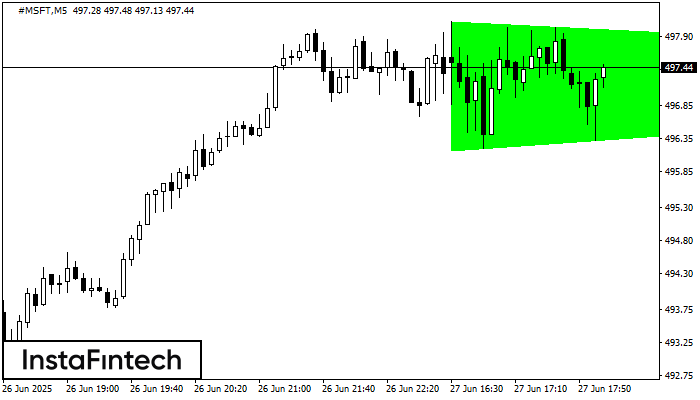
According to the chart of M5, #MSFT formed the Bullish Symmetrical Triangle pattern. The lower border of the pattern touches the coordinates 496.18/497.31 whereas the upper border goes across 498.13/497.31
The M5 and M15 time frames may have more false entry points.
Open chart in a new window


