

signal strength 1 of 5
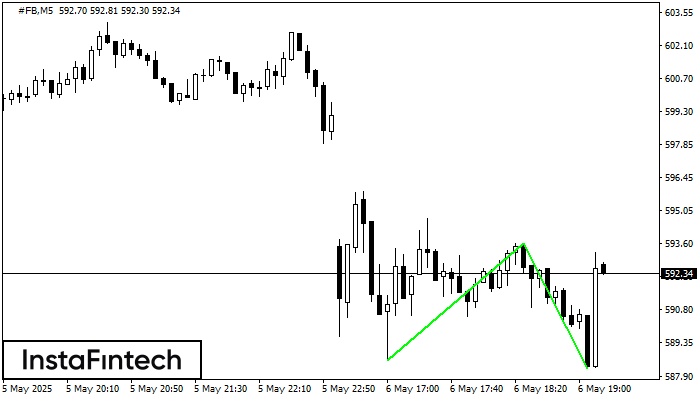
The Double Bottom pattern has been formed on #FB M5; the upper boundary is 593.61; the lower boundary is 588.27. The width of the pattern is 502 points. In case of a break of the upper boundary 593.61, a change in the trend can be predicted where the width of the pattern will coincide with the distance to a possible take profit level.
The M5 and M15 time frames may have more false entry points.
- All
- Double Top
- Flag
- Head and Shoulders
- Pennant
- Rectangle
- Triangle
- Triple top
- All
- #AAPL
- #AMZN
- #Bitcoin
- #EBAY
- #FB
- #GOOG
- #INTC
- #KO
- #MA
- #MCD
- #MSFT
- #NTDOY
- #PEP
- #TSLA
- #TWTR
- AUDCAD
- AUDCHF
- AUDJPY
- AUDUSD
- EURCAD
- EURCHF
- EURGBP
- EURJPY
- EURNZD
- EURRUB
- EURUSD
- GBPAUD
- GBPCHF
- GBPJPY
- GBPUSD
- GOLD
- NZDCAD
- NZDCHF
- NZDJPY
- NZDUSD
- SILVER
- USDCAD
- USDCHF
- USDJPY
- USDRUB
- All
- M5
- M15
- M30
- H1
- D1
- All
- Buy
- Sale
- All
- 1
- 2
- 3
- 4
- 5
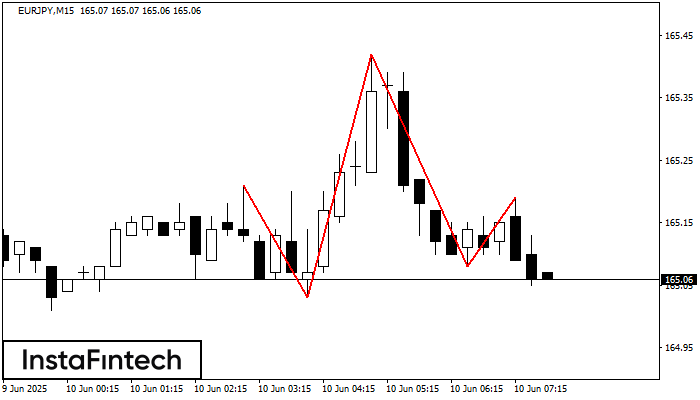
The technical pattern called Head and Shoulders has appeared on the chart of EURJPY M15. There are weighty reasons to suggest that the price will surpass the Neckline 165.03/165.08 after
The M5 and M15 time frames may have more false entry points.
Открыть график инструмента в новом окне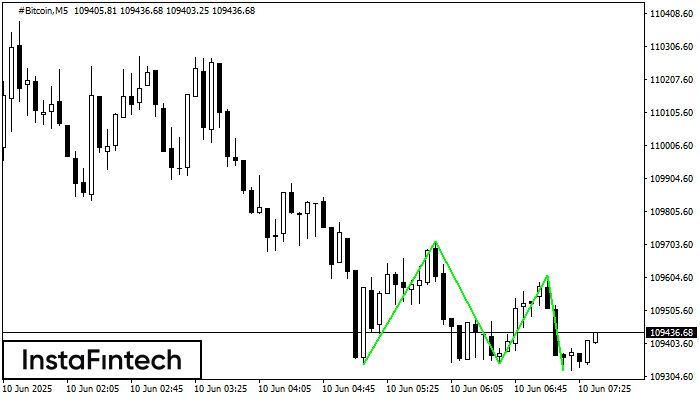
The Triple Bottom pattern has formed on the chart of the #Bitcoin M5 trading instrument. The pattern signals a change in the trend from downwards to upwards in the case
The M5 and M15 time frames may have more false entry points.
Открыть график инструмента в новом окне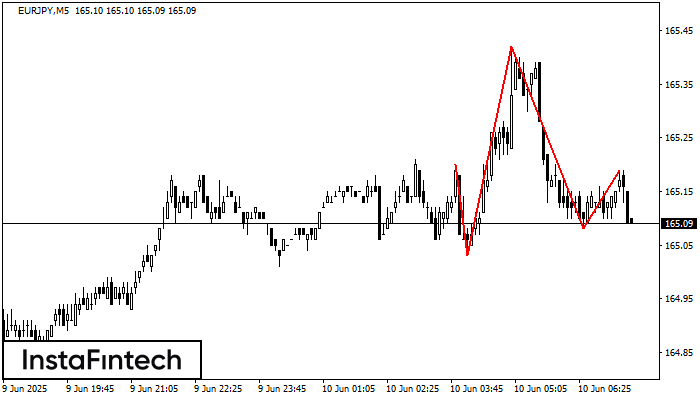
According to the chart of M5, EURJPY formed the Head and Shoulders pattern. The Head’s top is set at 165.42 while the median line of the Neck is found
The M5 and M15 time frames may have more false entry points.
Открыть график инструмента в новом окне


