


signal strength 2 of 5
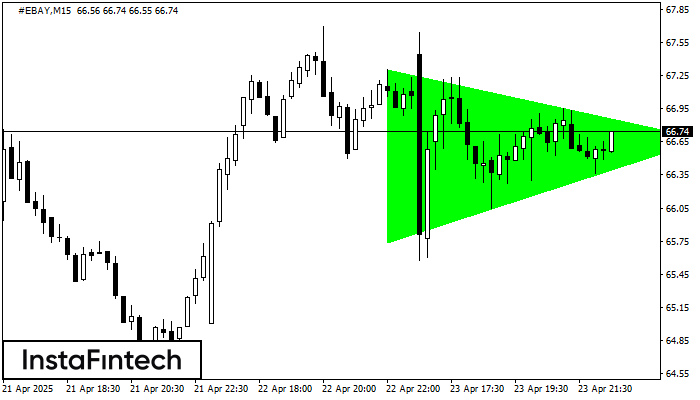
According to the chart of M15, #EBAY formed the Bullish Symmetrical Triangle pattern. Description: This is the pattern of a trend continuation. 67.31 and 65.74 are the coordinates of the upper and lower borders respectively. The pattern width is measured on the chart at 157 pips. Outlook: If the upper border 67.31 is broken, the price is likely to continue its move by 66.89.
The M5 and M15 time frames may have more false entry points.
- All
- Double Top
- Flag
- Head and Shoulders
- Pennant
- Rectangle
- Triangle
- Triple top
- All
- #AAPL
- #AMZN
- #Bitcoin
- #EBAY
- #FB
- #GOOG
- #INTC
- #KO
- #MA
- #MCD
- #MSFT
- #NTDOY
- #PEP
- #TSLA
- #TWTR
- AUDCAD
- AUDCHF
- AUDJPY
- AUDUSD
- EURCAD
- EURCHF
- EURGBP
- EURJPY
- EURNZD
- EURRUB
- EURUSD
- GBPAUD
- GBPCHF
- GBPJPY
- GBPUSD
- GOLD
- NZDCAD
- NZDCHF
- NZDJPY
- NZDUSD
- SILVER
- USDCAD
- USDCHF
- USDJPY
- USDRUB
- All
- M5
- M15
- M30
- H1
- D1
- All
- Buy
- Sale
- All
- 1
- 2
- 3
- 4
- 5
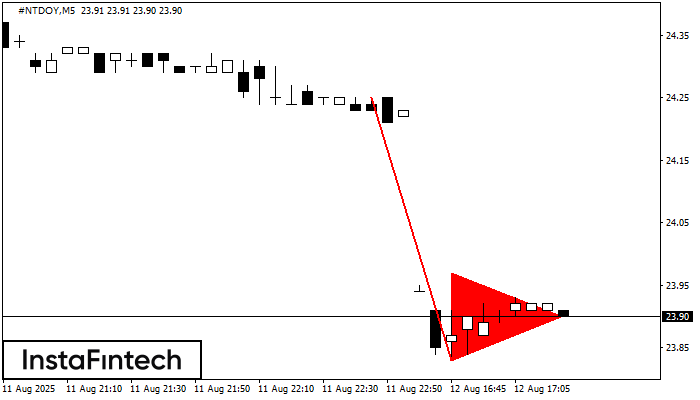
The Bearish pennant pattern has formed on the #NTDOY M5 chart. This pattern type is characterized by a slight slowdown after which the price will move in the direction
The M5 and M15 time frames may have more false entry points.
Open chart in a new window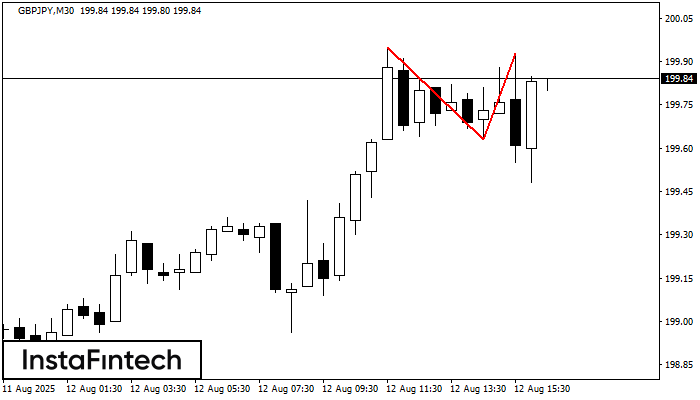
The Double Top pattern has been formed on GBPJPY M30. It signals that the trend has been changed from upwards to downwards. Probably, if the base of the pattern 199.63
Open chart in a new window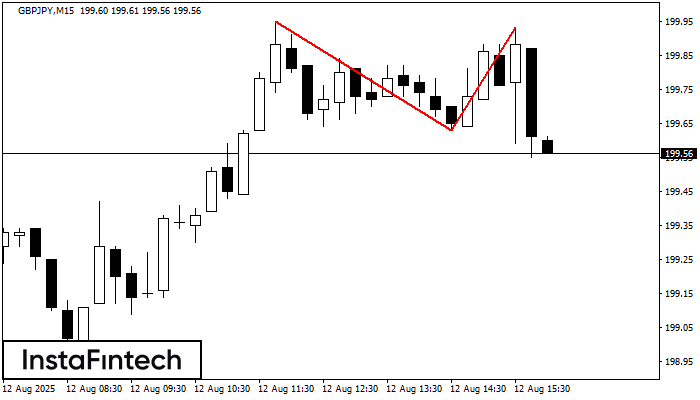
The Double Top reversal pattern has been formed on GBPJPY M15. Characteristics: the upper boundary 199.95; the lower boundary 199.63; the width of the pattern is 30 points. Sell trades
The M5 and M15 time frames may have more false entry points.
Open chart in a new window


