


signal strength 2 of 5

According to the chart of M15, EURJPY formed the Bullish Symmetrical Triangle pattern, which signals the trend will continue. Description. The upper border of the pattern touches the coordinates 162.14/161.96 whereas the lower border goes across 161.84/161.96. The pattern width is measured on the chart at 30 pips. If the Bullish Symmetrical Triangle pattern is in progress during the upward trend, this indicates the current trend will go on. In case 161.96 is broken, the price could continue its move toward 162.18.
The M5 and M15 time frames may have more false entry points.
See Also
- All
- Double Top
- Flag
- Head and Shoulders
- Pennant
- Rectangle
- Triangle
- Triple top
- All
- #AAPL
- #AMZN
- #Bitcoin
- #EBAY
- #FB
- #GOOG
- #INTC
- #KO
- #MA
- #MCD
- #MSFT
- #NTDOY
- #PEP
- #TSLA
- #TWTR
- AUDCAD
- AUDCHF
- AUDJPY
- AUDUSD
- EURCAD
- EURCHF
- EURGBP
- EURJPY
- EURNZD
- EURRUB
- EURUSD
- GBPAUD
- GBPCHF
- GBPJPY
- GBPUSD
- GOLD
- NZDCAD
- NZDCHF
- NZDJPY
- NZDUSD
- SILVER
- USDCAD
- USDCHF
- USDJPY
- USDRUB
- All
- M5
- M15
- M30
- H1
- D1
- All
- Buy
- Sale
- All
- 1
- 2
- 3
- 4
- 5
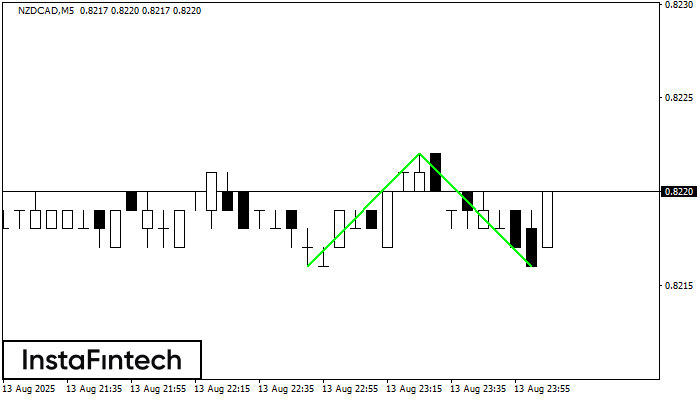
The Double Bottom pattern has been formed on NZDCAD M5; the upper boundary is 0.8222; the lower boundary is 0.8216. The width of the pattern is 6 points. In case
The M5 and M15 time frames may have more false entry points.
Open chart in a new window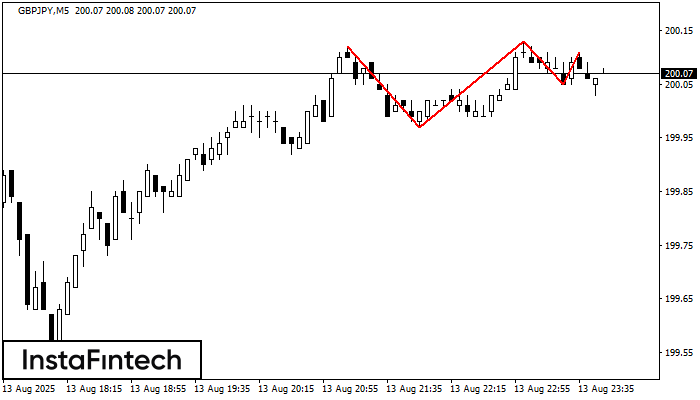
The Triple Top pattern has formed on the chart of the GBPJPY M5 trading instrument. It is a reversal pattern featuring the following characteristics: resistance level 1, support level -8
The M5 and M15 time frames may have more false entry points.
Open chart in a new window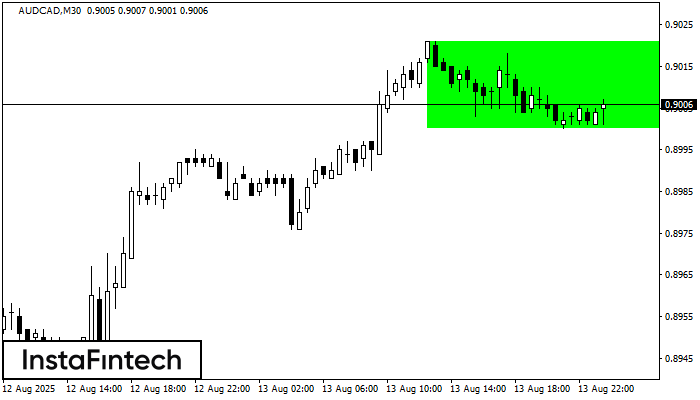
According to the chart of M30, AUDCAD formed the Bullish Rectangle. This type of a pattern indicates a trend continuation. It consists of two levels: resistance 0.9021 and support 0.9000
Open chart in a new window


