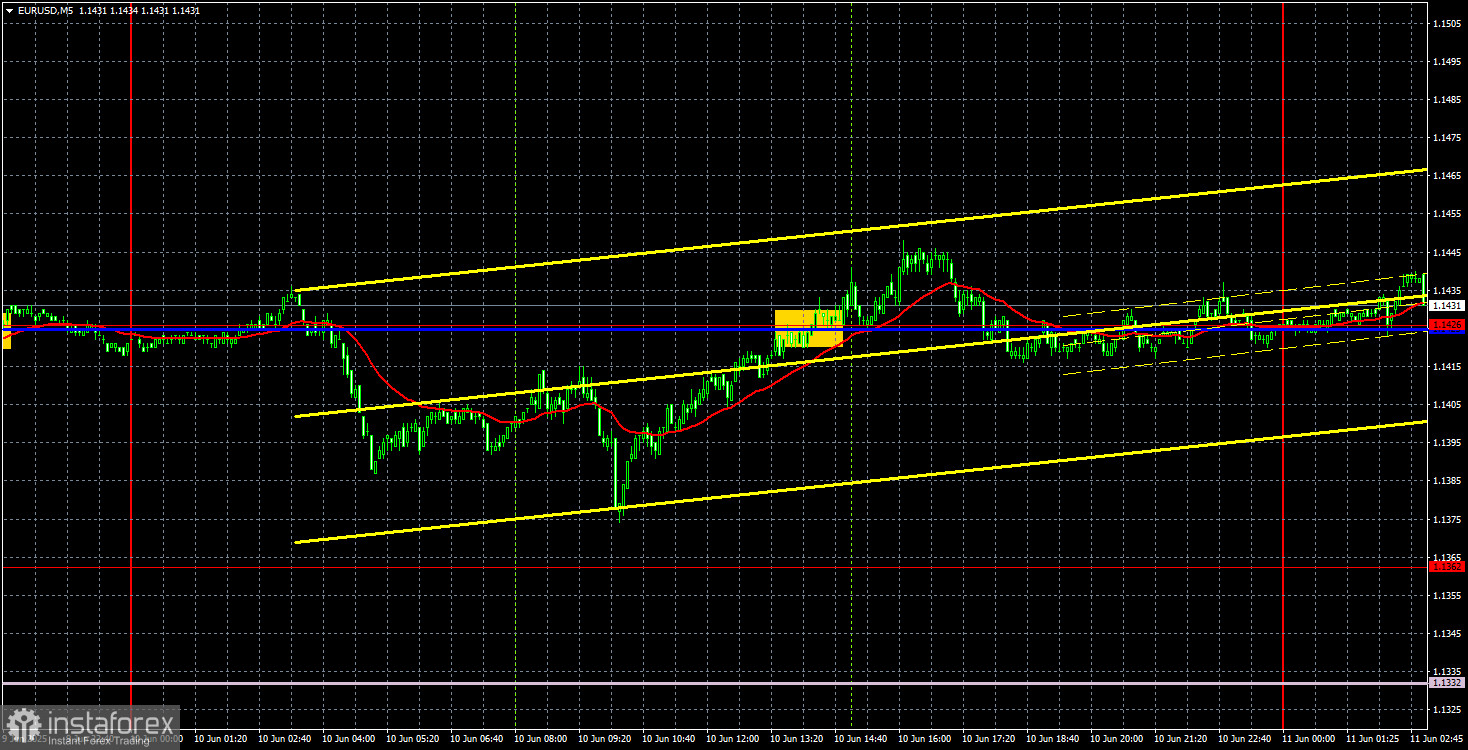
EUR/USD 5-Minute Analysis
The EUR/USD currency pair continued to move in both directions throughout Tuesday. These movements indicate a flat market. Let us recall that earlier, the pair broke through the ascending trend line for the second time, which did not trigger any significant decline. Thus, once again, the US dollar fails to strengthen, even when there are quite reasonable grounds for it.
Previously, we encountered situations more than once where decent macroeconomic data or a strong fundamental backdrop did not lead to US dollar appreciation. The market ignored them, focusing instead on more important and global events, which, of course, are tied to Donald Trump. Therefore, it has often happened that the dollar refuses to rise, and the market refuses to buy it. As we can see, technical sell signals (which imply dollar strength) also do not play out. Local sell signals may bring small profits, but trend reversal signals currently mean little. The price has already broken through the current trend line several times, only to resume upward movement afterward.
On Tuesday, there were no macroeconomic events in the US or the Eurozone, and the market continues to closely monitor the unrest in the US and its "Trump-style" methods of suppression—that is, using professional military personnel. The market followed the second round of negotiations between China and the US, but no information has emerged yet.
Only one trading signal was formed on the 5-minute TF yesterday, but the pair's movement left much to be desired. Thus, traders could have opened a long position after the price broke above the critical line, but the euro advanced only 15 points. This was enough to set a Stop Loss at breakeven when the trade was closed.
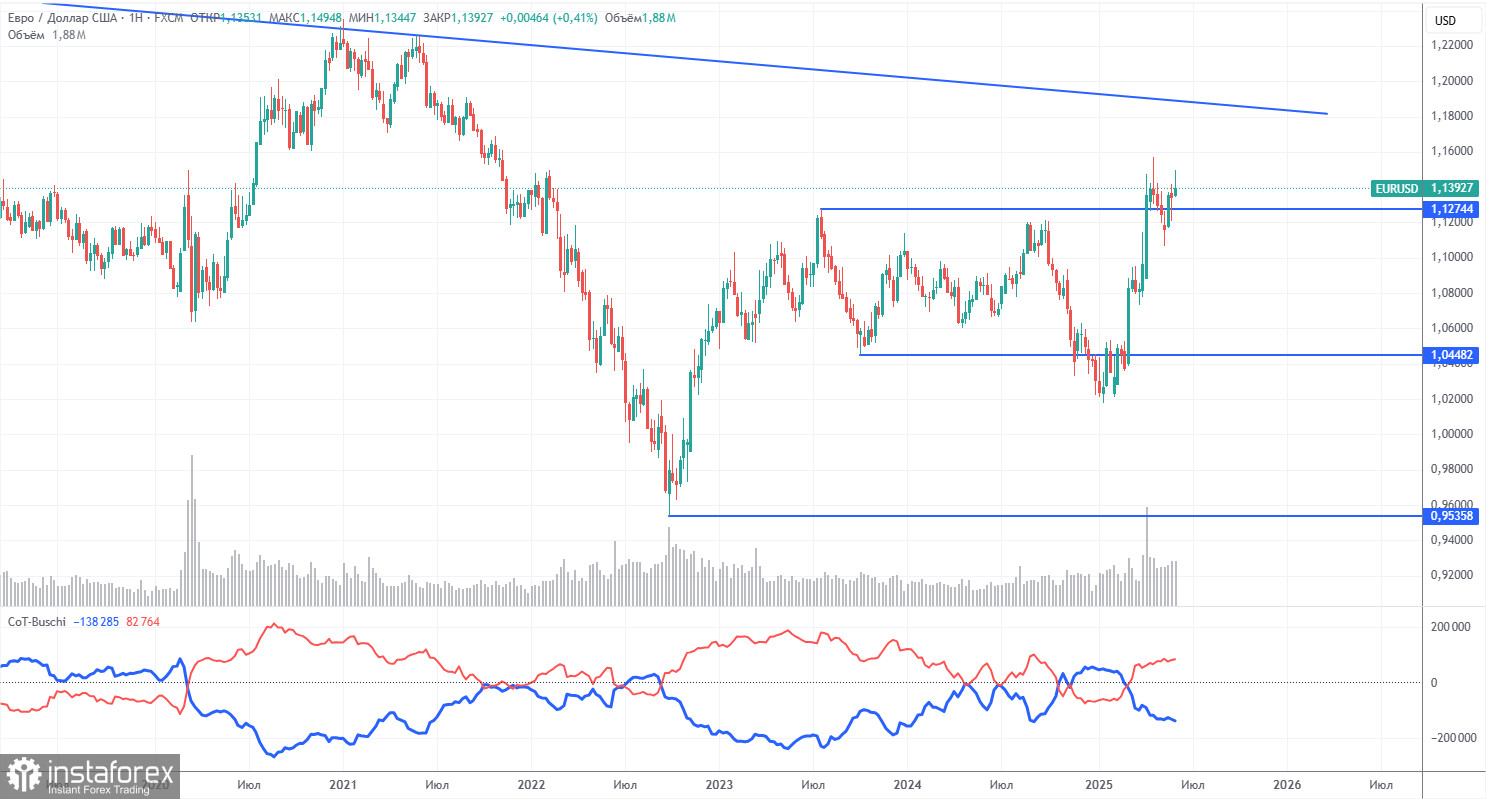
COT Report
The latest COT report is dated June 3. The chart above shows that the net position of non-commercial traders had long been "bullish," and the bears barely managed to gain the upper hand at the end of 2024 but quickly lost it. Since Trump took office, only the dollar has been falling. We cannot confidently say that the dollar's decline will persist, but current global developments indicate this possibility.
We still see no fundamental factors for strengthening the euro, but one very significant factor is the decline of the dollar. The global downward trend persists, but what does the trend even matter now? Once Trump ends his trade wars, the dollar might start growing again — but will he end them, and when?
The red and blue lines have crossed again, meaning the market returns to a "bullish" trend. Over the last reporting week, the number of longs among the "Non-commercial" group decreased by 1,500, while shorts dropped by 4,800. As a result, the net position increased by 3,300.
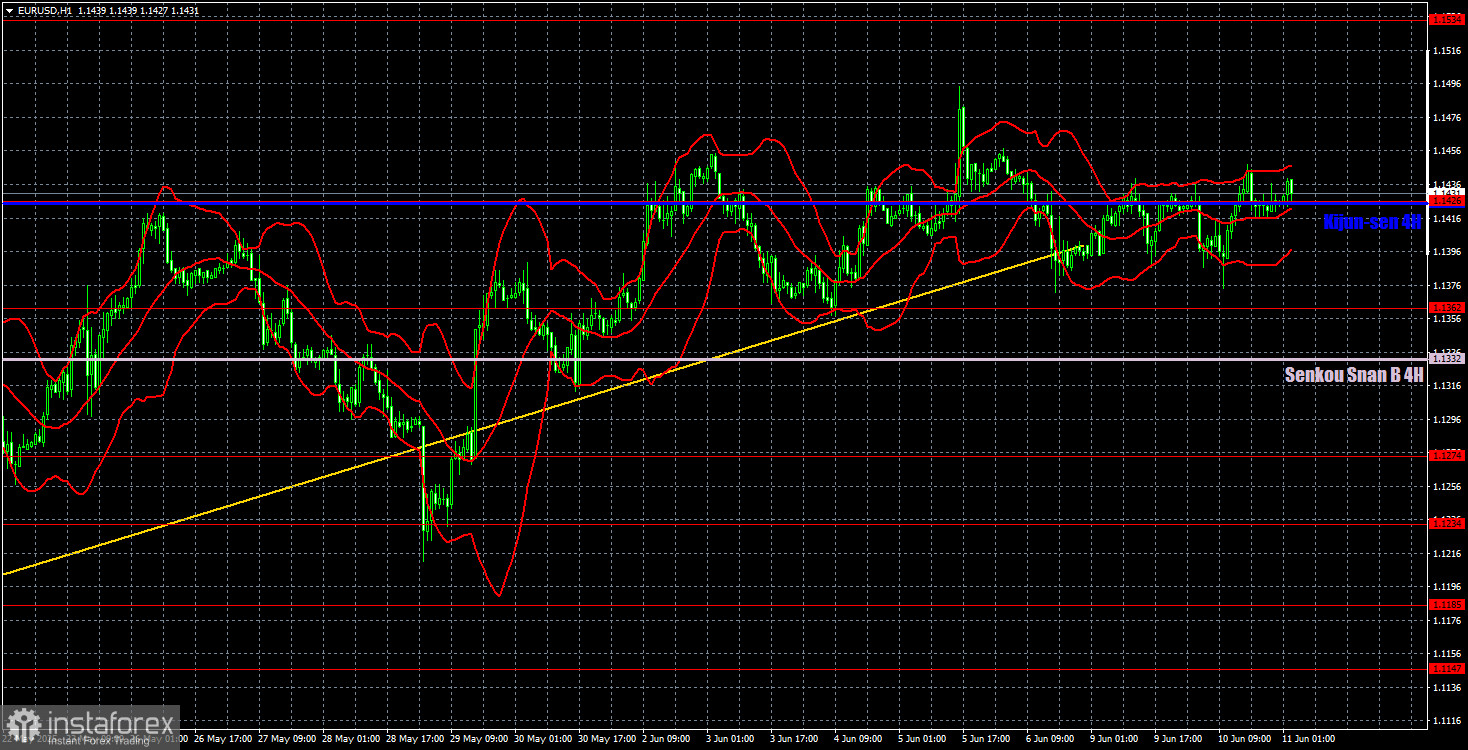
EUR/USD 1-Hour Analysis
In the hourly timeframe, the EUR/USD pair maintains a local uptrend despite two breaks of the ascending trend line. As before (over the past 4 months), the market reacts only to events related to Trump, his decisions, and the trade war. Since there is little positive news on these topics, the dollar continues to decline despite everything. Let us remind you that the monetary policy of the Federal Reserve, combined with the European Central Bank policy, would suggest strong dollar growth. However, as we've said, this factor (like many others) currently holds no significance for the market.
For June 11, we highlight the following levels for trading: 1.0949, 1.1006, 1.1092, 1.1147, 1.1185, 1.1234, 1.1274, 1.1362, 1.1426, 1.1534, 1.1607, as well as the Senkou Span B (1.1332) and Kijun-sen (1.1425) lines. The Ichimoku indicator lines may shift throughout the day, which should be considered when identifying trading signals. Don't forget to place a Stop Loss at breakeven if the price moves 15 pips in the right direction. This will protect you from possible losses if the signal is false.
On Wednesday, the Eurozone macroeconomic and fundamental events calendar is empty, while the US will publish an inflation report, which may again provoke a short-lived emotional spike among traders. We do not believe this report can end the current local flat. The only news from Trump and the China-US negotiations can bring the flat to an end.
Illustration Explanations:
- Support and resistance price levels – thick red lines where movement may end. They are not trading signal sources.
- Kijun-sen and Senkou Span B lines—These are strong Ichimoku indicator lines transferred to the hourly timeframe from the 4-hour one.
- Extremum levels – thin red lines where the price has previously rebounded. These act as trading signal sources.
- Yellow lines – trend lines, trend channels, and other technical patterns.
- COT Indicator 1 on the charts – the size of the net position for each category of traders.