empty
30.05.2025 10:58 AM
Forecast for EUR/USD on May 30, 2025

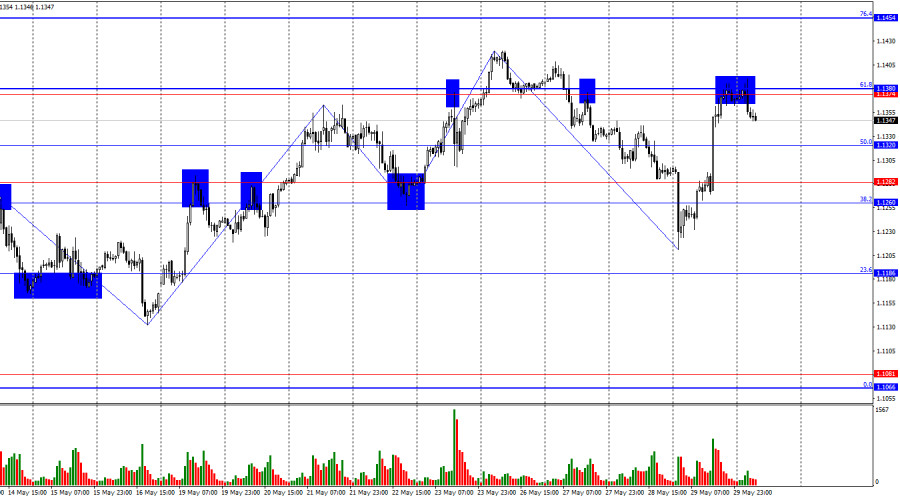
On Thursday, the EUR/USD pair sharply reversed in favor of the euro and rose into the resistance zone of 1.1374–1.1380. A rebound from this zone favored the U.S. dollar and the potential resumption of a decline towards the 50.0% Fibonacci level at 1.1320 and the support zone of 1.1260–1.1282. Yesterday, the waves signaled the end of the bullish trend. A strong corrective pullback combined with a good sell signal suggests a new decline for the pair. A consolidation above the 1.1374–1.1380 level would allow for further growth toward the 76.4% Fibonacci retracement at 1.1454.
This image is no longer relevant

The wave situation on the hourly chart has changed. The last completed upward wave broke the previous high, but the last downward wave broke the previous low. Thus, the trend may now be shifting to a bearish one. Recent news regarding the cancellation of tariff hikes for the European Union and mutual tariff reductions between China and the U.S. supported the bears, but yesterday the Court first ruled to cancel all of Trump's tariffs and then postponed its decision by 14 days, allowing the bulls to launch a striking counterattack.

The news on Thursday was not expected to bring anything interesting, but overnight the U.S. Court of International Trade ruled that Trump had exceeded his presidential powers when he imposed global tariffs on imports from many countries. The Court satisfied the claim of 12 U.S. states, stating that only Congress has the authority to impose tariffs, or at least must approve them before they are enacted. Trump had declared a national emergency in trade due to the trade deficit. Under U.S. law, a national emergency allows the president to make decisions independently, but, as it turns out, not regarding tariffs. By the evening, the situation became almost comical: the Court reviewed Trump's immediate appeal and, citing national security, suspended its decision for 14 days. Thus, for the next two weeks, all tariffs will definitely remain in effect.
This image is no longer relevant

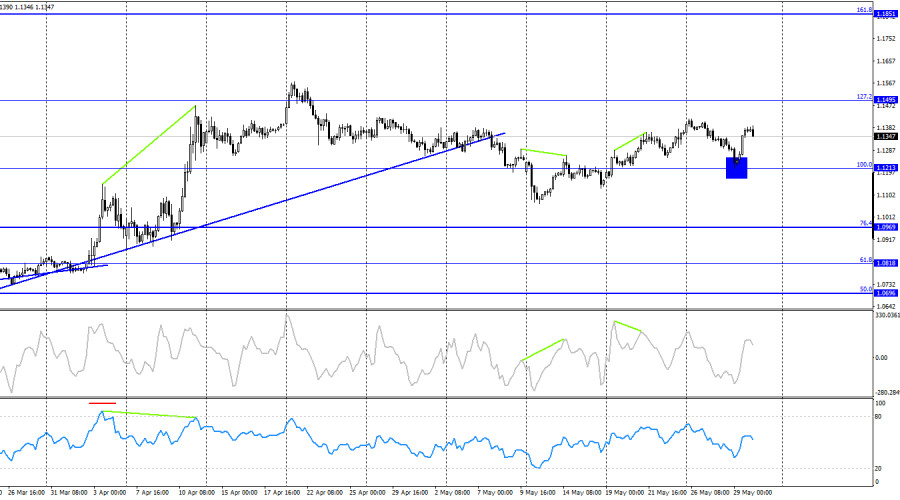
On the 4-hour chart, the pair returned to the 100.0% Fibonacci retracement at 1.1213 and rebounded from it. This rebound enabled a reversal in favor of the euro and the expectation of growth toward the 127.2% Fibonacci retracement at 1.1495. A consolidation below 1.1213 would signal a continuation of the decline toward the next Fibonacci level at 76.4%, or 1.0969. No looming divergences are observed on any indicator.

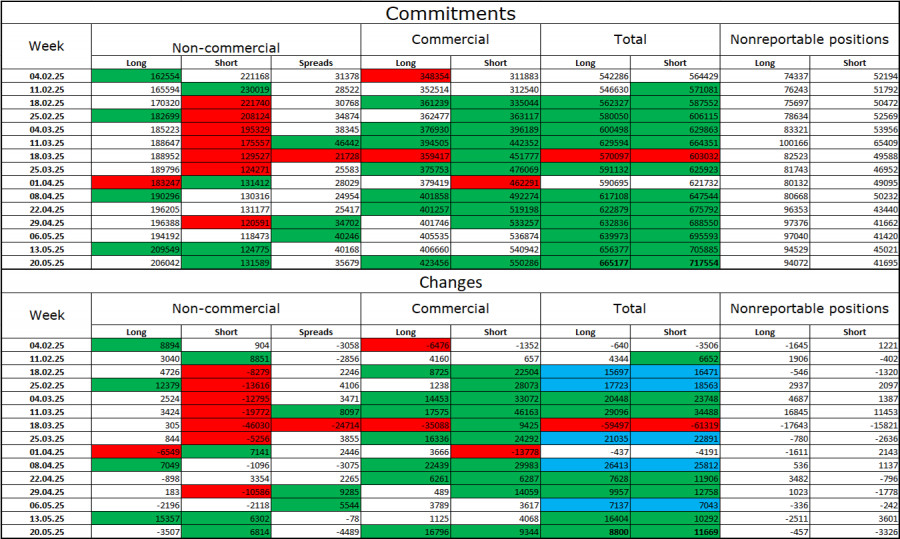
Commitments of Traders (COT) Report:

This image is no longer relevant

During the last reporting week, professional traders closed 3,507 long positions and opened 6,814 short positions. The sentiment of the "Non-commercial" group remains bullish — thanks to Donald Trump. The total number of long positions held by speculators now stands at 206,000, while short positions are at 132,000, and the gap between them (with rare exceptions) continues to widen. Thus, the euro remains in demand, while the dollar does not. The situation remains unchanged.

For sixteen consecutive weeks, large players have been reducing short positions and increasing longs. The divergence in monetary policy between the ECB and the Fed still works in favor of the dollar, but Donald Trump's policy is a more significant factor for traders, as it could lead to a recession in the U.S. economy and a host of other long-term structural problems.

Economic News Calendar for the U.S. and Eurozone:

  • Eurozone – Retail Sales Change in Germany (06:00 UTC)
  • Eurozone – Inflation Rate in Germany (12:00 UTC)
  • U.S. – PCE Price Index (12:30 UTC)
  • U.S. – Personal Income and Spending (12:30 UTC)
  • U.S. – University of Michigan Consumer Sentiment Index (14:00 UTC)

On May 30, the economic event calendar includes five entries. The impact of the news background on market sentiment on Friday may be moderate, but most likely traders will focus more on the ongoing tariff saga rather than economic statistics. Thursday's events delivered significant news, and whether bullish or bearish, Friday's data will likely be secondary to the tariff developments.

EUR/USD Forecast and Trading Tips:

Sales were possible today on a bounce from the 1.1374–1.1380 zone with targets at 1.1320 and 1.1260–1.1282. Today, I recommend considering purchases on a bounce from any level on the hourly chart with a target of 1.1374–1.1380 and higher.

Fibonacci levels are drawn from 1.1574–1.1066 on the hourly chart and from 1.1214–1.0179 on the 4-hour chart.

Samir Klishi,
Analytical expert of InstaForex
© 2007-2025
Select timeframe
5
min
15
min
30
min
1
hour
4
hours
1
day
1
week
Earn on cryptocurrency rate changes with InstaForex
Download MetaTrader 4 and open your first trade
  • Grand Choice
    Contest by
    InstaForex
    InstaForex always strives to help you
    fulfill your biggest dreams.
    JOIN CONTEST

Recommended Stories

Forecast for EUR/USD on June 13, 2025

On Thursday, the EUR/USD pair continued its upward movement and consolidated above the 100.0% Fibonacci retracement level at 1.1574. However, during the night, a sharp reversal occurred in favor

Samir Klishi 11:52 2025-06-13 UTC+2

Forecast for GBP/USD on June 13, 2025

On the hourly chart, the GBP/USD pair on Thursday rebounded from the 1.3520 level, surged to the resistance zone of 1.3611–1.3620, bounced off it twice, and then fell back

Samir Klishi 11:49 2025-06-13 UTC+2

EUR/USD. June 12. A Setback for the Dollar

Good day, dear traders! On Wednesday, the EUR/USD pair continued its upward movement after rebounding from the support zone of 1.1374–1.1380. It successfully consolidated above the 76.4% Fibonacci retracement level

Samir Klishi 10:15 2025-06-12 UTC+2

GBP/USD. June 12. British Economy Falters

Good day, dear traders! On the hourly chart, on Wednesday, the GBP/USD pair reversed in favor of the British pound and consolidated above the 161.8% Fibonacci retracement level at 1.3520

Samir Klishi 10:15 2025-06-12 UTC+2

Technical Analysis of Daily Price Movement Crude Oil Commodity Instrument, Thursday June 12, 2025.

If we look at the daily chart of the Crude Oil commodity instrument, there appears to be a Divergence between the price movement of #CL and the Stochastic Oscillator indicator

Arief Makmur 08:10 2025-06-12 UTC+2

Technical Analysis of Intraday Price Movement of Nasdaq 100 Index, Thursday June 12, 2025.

On the 4-hour chart of the Nasdaq 100 index, there is a divergence between its price movement and the Stochastic Oscillator indicator, especially with the current confirmation of the price

Arief Makmur 08:10 2025-06-12 UTC+2

Trading Signals for EUR/USD for June 12-19, 2025: sell below 1.1500 (21 SMA - 8/8 Murray)

If the euro price falls below 1.1500 in the coming hours, this could be seen as an opportunity to sell. Technically, it appears overbought on the H4 chart and could

Dimitrios Zappas 05:33 2025-06-12 UTC+2

Trading Signals for GOLD (XAU/USD) for June 12-19, 2025: sell below $3,386 (21 SMA - 7/8 Murray)

The XAU/USD trend remains bullish as long as the price consolidates above 3,331. Therefore, it would be prudent to buy gold as long as the price consolidates above 3,359, where

Dimitrios Zappas 05:32 2025-06-12 UTC+2

EUR/USD Forecast for June 12, 2025

The U.S. inflation data released on Wednesday stirred the markets: the dollar index dropped by 0.47%, WTI oil surged by 5.54%, gold rose by 1.27%, and 5-year U.S. Treasury yields

Laurie Bailey 04:40 2025-06-12 UTC+2

GBP/USD Forecast for June 12, 2025

On Wednesday, the British pound successfully avoided a decline below technical support levels, reversing upward from them. The price rebounded from the MACD indicator line on the daily chart, while

Laurie Bailey 04:40 2025-06-12 UTC+2
Can't speak right now?
Ask your question in the chat.
Widget callback
 

Dear visitor,

Your IP address shows that you are currently located in the USA. If you are a resident of the United States, you are prohibited from using the services of InstaFintech Group including online trading, online transfers, deposit/withdrawal of funds, etc.

If you think you are seeing this message by mistake and your location is not the US, kindly proceed to the website. Otherwise, you must leave the website in order to comply with government restrictions.

Why does your IP address show your location as the USA?

  • - you are using a VPN provided by a hosting company based in the United States;
  • - your IP does not have proper WHOIS records;
  • - an error occurred in the WHOIS geolocation database.

Please confirm whether you are a US resident or not by clicking the relevant button below. If you choose the wrong option, being a US resident, you will not be able to open an account with InstaForex anyway.

We are sorry for any inconvenience caused by this message.