empty
26.05.2025 03:44 AM
Trading Recommendations and Analysis for GBP/USD on May 26: The British Pound Back on Top

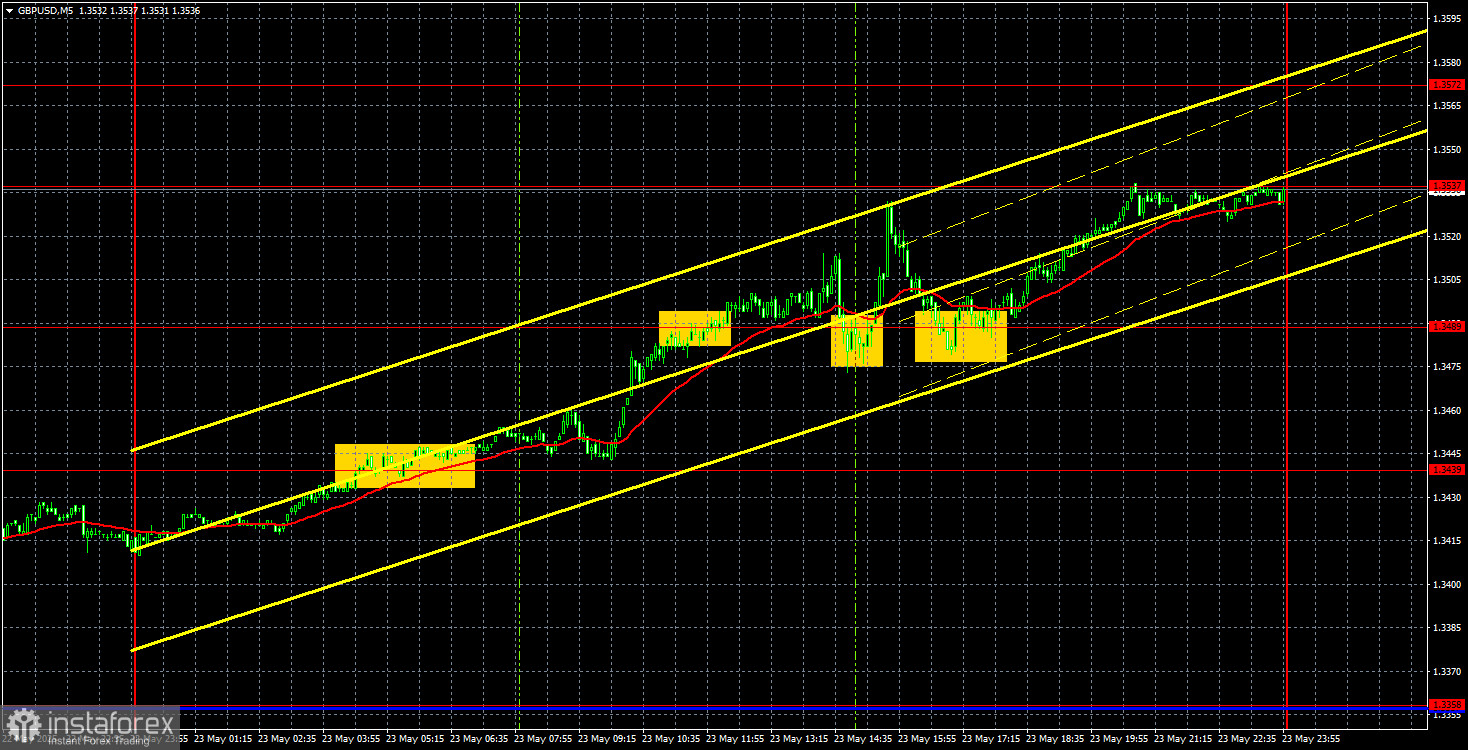
GBP/USD 5-Minute Analysis

This image is no longer relevant

The GBP/USD currency pair broke out of its sideways channel through the upper boundary, paused briefly to "think it over," waited for new aggressive moves from Trump, and then confidently transitioned into another upward surge. We've already discussed the reasons behind the latest drop in the U.S. dollar. There could be many more such drops simply because another one of Trump's "brilliant" plans has "somehow" failed again. Trump was counting on all the countries on his "blacklist" rushing to appease him during the three-month grace period, leaving him with nothing to do but sign 75 trade deals and declare total victory over the injustice and exploitation of the United States "that's gone on for decades." We assumed that smaller countries would try to make deals with Washington since losing access to the U.S. market would be a heavy economic blow.

However, it turns out that not only the EU or China are unwilling (or unable) to negotiate, but there's also no information about deals or negotiations with smaller countries. It remains unclear whether any talks are happening with anyone at all. As for statements from the White House, they're not worth paying attention to. According to Trump and his team, the U.S. economy is growing. If it's not growing, it's Biden's fault. If it's shrinking, it's temporary. There are no deals, the U.S. president is furious, and new tariffs are on the table. What else should the market do but dump the "conflict currency"?

On the 5-minute chart, Friday's trading signals were suboptimal as the market grew nervous over Trump's campaign for global justice. Ironically, the Republican president is now considering tariffs against Apple, which "for some reason" refuses to relocate production back to the U.S.

COT Report

This image is no longer relevant

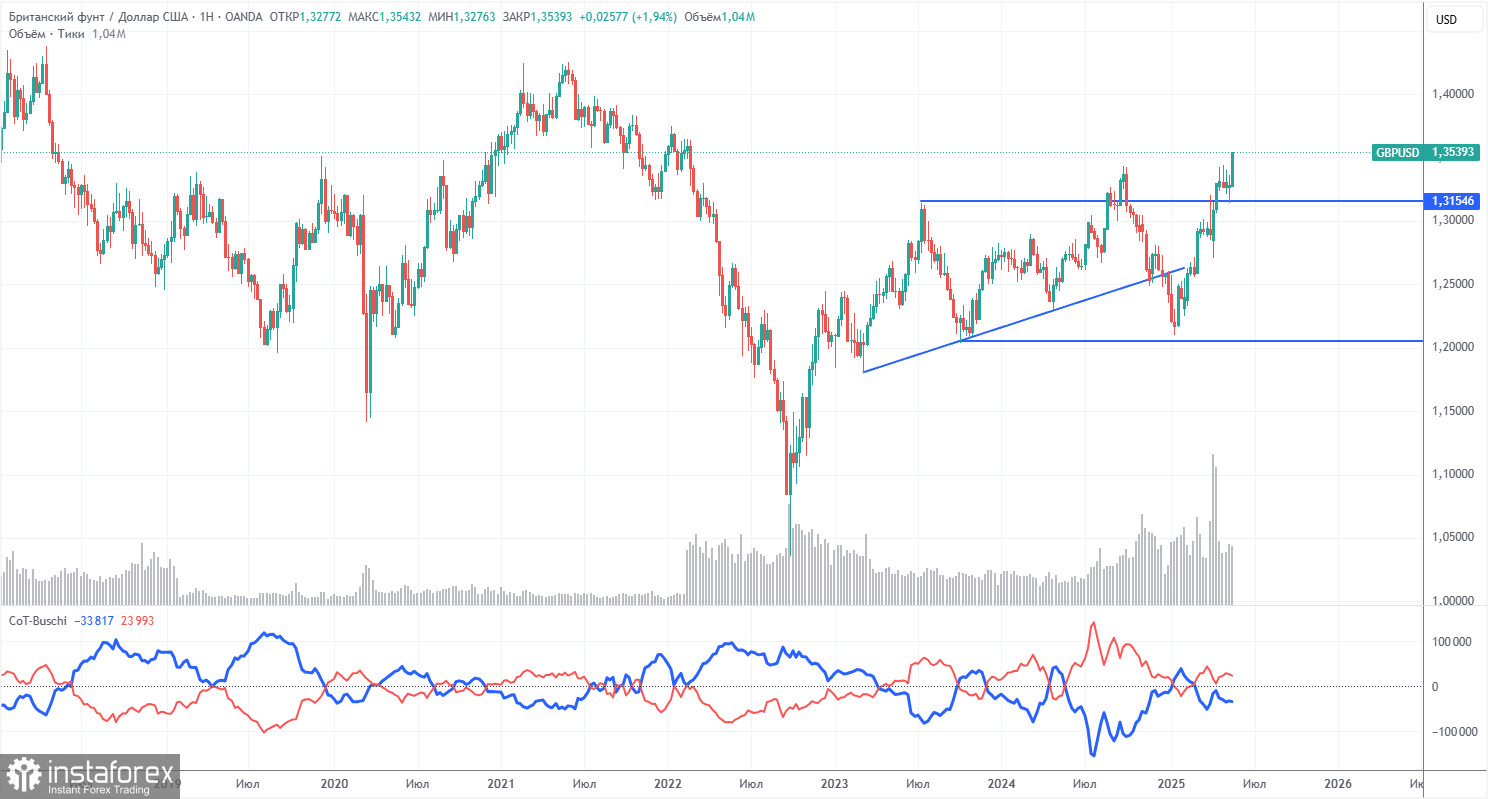
COT reports on the British pound show that commercial trader sentiment has fluctuated constantly in recent years. The red and blue lines, representing the net positions of commercial and non-commercial traders, cross each other frequently and usually hover around the zero mark. They are close together again, indicating a roughly equal number of long and short positions. However, the net position has shown steady growth over the past year and a half.

The dollar continues to weaken due to Donald Trump's policies, so market makers' demand for the pound is not particularly important now. If a global trade war de-escalation resumes, the U.S. dollar may have an opportunity to strengthen — but that opportunity still needs to be seized.

According to the latest report on the British pound, the "Non-commercial" group closed 1,400 long contracts and opened 1,800 short contracts, resulting in a 3,200 decrease in the net long position.

The pound has surged significantly recently, but it's important to understand that the only reason is Trump's policy. Once that factor is neutralized, the dollar may begin to rise again. The pound itself has no intrinsic growth drivers. Nevertheless, the "Trump factor" is enough for traders to base decisions on now.

GBP/USD 1-Hour Analysis

This image is no longer relevant

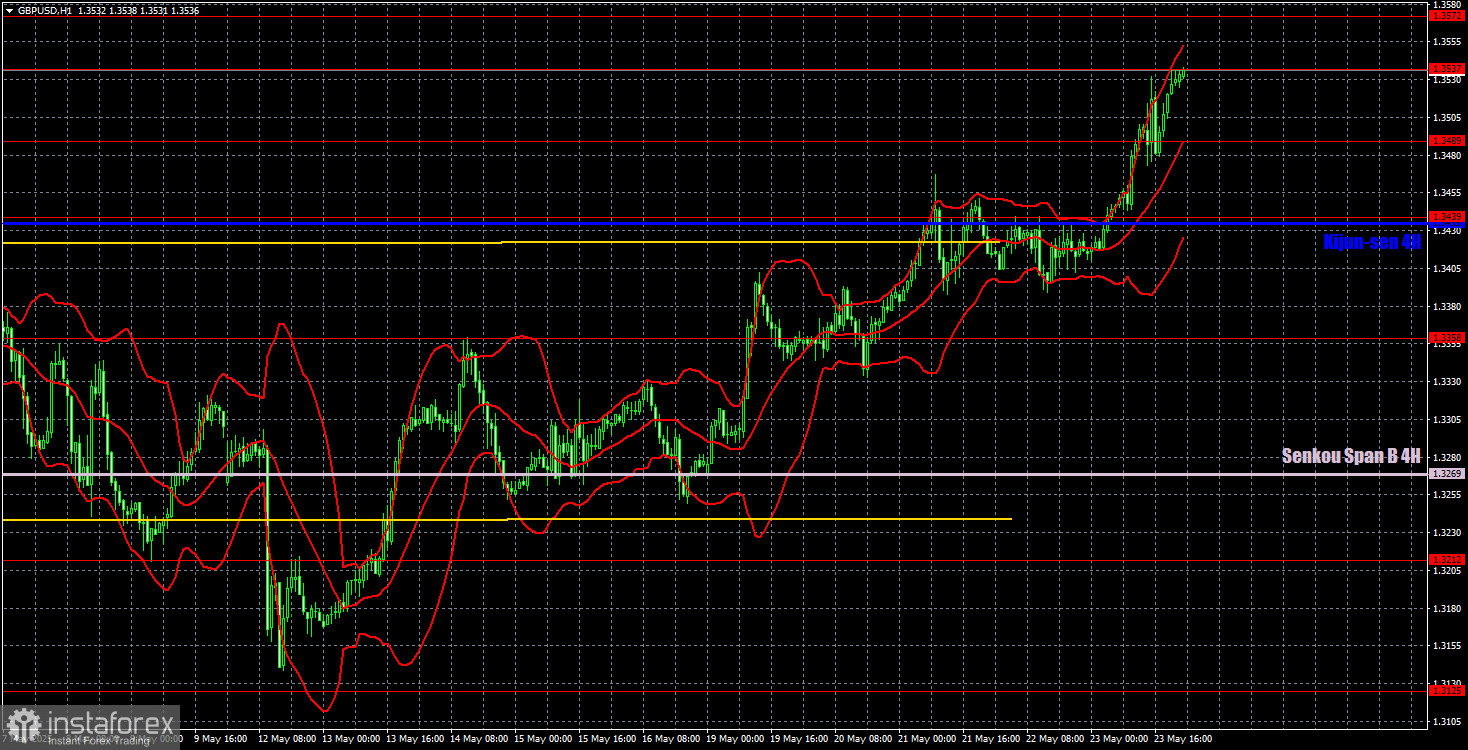
On the hourly timeframe, the GBP/USD pair broke out of its sideways channel, this time through the upper boundary. Further movement now depends entirely on Donald Trump and developments in the global trade war. However, we can also say that the movement depends on general sentiment toward the U.S. and its president personally. At the moment, that sentiment remains sharply negative. The dollar continues to fall — and when tariff headlines appear, it falls twice as hard.

For May 26, the key levels to watch are 1.2863, 1.2981–1.2987, 1.3050, 1.3125, 1.3212, 1.3288, 1.3358, 1.3439, 1.3489, 1.3537, 1.3572, 1.3637–1.3667, and 1.3741. The Senkou Span B line (1.3269) and the Kijun-sen line (1.3435) may also provide trading signals. Once the price moves 20 pips in the right direction, a stop loss should be moved to breakeven. Ichimoku indicator lines may shift throughout the day and should be factored into signal assessments.

No critical or noteworthy events are scheduled for Monday in the U.K. or the U.S., but the dollar may continue its next wave of decline.

Illustration Explanations:

  • Support and resistance price levels – thick red lines where movement may end. They are not trading signal sources.
  • Kijun-sen and Senkou Span B lines—These are strong Ichimoku indicator lines transferred to the hourly timeframe from the 4-hour one.
  • Extremum levels – thin red lines where the price has previously rebounded. These act as trading signal sources.
  • Yellow lines – trend lines, trend channels, and other technical patterns.
  • COT Indicator 1 on the charts – the size of the net position for each category of traders.
Paolo Greco,
Analytical expert of InstaForex
© 2007-2025
Select timeframe
5
min
15
min
30
min
1
hour
4
hours
1
day
1
week
Earn on cryptocurrency rate changes with InstaForex
Download MetaTrader 4 and open your first trade
  • Grand Choice
    Contest by
    InstaForex
    InstaForex always strives to help you
    fulfill your biggest dreams.
    JOIN CONTEST

Recommended Stories

Trading Recommendations and Analysis for GBP/USD on June 12: The Pound Finds a New Reason to Cheer

On Wednesday, the GBP/USD currency pair resumed its upward movement. As previously noted, the British currency currently has no valid reason to decline against the U.S. dollar—specifically, against the U.S

Paolo Greco 04:00 2025-06-12 UTC+2

Trading Recommendations and Analysis for EUR/USD on June 12: Even Inflation Didn't Please the Dollar

The EUR/USD currency pair traded very differently throughout Wednesday. During the European trading session, the pair continued its sideways movement, which had persisted for several days. There was no macroeconomic

Paolo Greco 03:55 2025-06-12 UTC+2

GBP/USD: Trading Plan for the U.S. Session on June 11th (Review of Morning Trades)

In my morning forecast, I drew attention to the 1.3483 level and planned to make trading decisions based on it. Let's look at the 5-minute chart and analyze what happened

Miroslaw Bawulski 18:41 2025-06-11 UTC+2

EUR/USD: Trading Plan for the U.S. Session on June 11th (Review of Morning Trades)

In my morning forecast, I highlighted the 1.1425 level and planned to make entry decisions based on it. Let's look at the 5-minute chart and examine what happened. The price

Miroslaw Bawulski 18:38 2025-06-11 UTC+2

How to Trade the GBP/USD Pair on June 11? Simple Tips and Trade Analysis for Beginners

Analysis of Tuesday's Trades 1H Chart of GBP/USD On Tuesday, the GBP/USD pair traded with a downward bias, which was justified by a few factors. First, the pair consolidated below

Paolo Greco 06:10 2025-06-11 UTC+2

How to Trade the EUR/USD Pair on June 11? Simple Tips and Trade Analysis for Beginners

Analysis of Tuesday's Trades 1H Chart of EUR/USD On Tuesday, the EUR/USD currency pair again showed no intention of actively trading. Over the past three days, a sideways channel

Paolo Greco 06:10 2025-06-11 UTC+2

Trading Recommendations and Analysis for GBP/USD on June 11: The Pound Pauses Before a New Surge

The GBP/USD currency pair continued trading rather chaotically on Tuesday but with a bearish tone. The British pound at least slightly declined after the trend shifted downward. Recall that

Paolo Greco 03:31 2025-06-11 UTC+2

Trading Recommendations and Analysis for EUR/USD on June 11: Flat Movement at Highs

The EUR/USD currency pair continued to move in both directions throughout Tuesday. These movements indicate a flat market. Let us recall that earlier, the pair broke through the ascending trend

Paolo Greco 03:31 2025-06-11 UTC+2

GBP/USD: Trading Plan for the U.S. Session on June 10th (Review of Morning Trades)

In my morning forecast, I drew attention to the 1.3545 level and planned to base market entry decisions on it. Let's look at the 5-minute chart to see what happened

Miroslaw Bawulski 18:26 2025-06-10 UTC+2

EUR/USD: Trading Plan for the U.S. Session on June 10th (Review of Morning Trades)

In my morning forecast, I highlighted the level of 1.1388 and planned to make market entry decisions based on it. Let's take a look at the 5-minute chart

Miroslaw Bawulski 18:22 2025-06-10 UTC+2
Can't speak right now?
Ask your question in the chat.
Widget callback
 

Dear visitor,

Your IP address shows that you are currently located in the USA. If you are a resident of the United States, you are prohibited from using the services of InstaFintech Group including online trading, online transfers, deposit/withdrawal of funds, etc.

If you think you are seeing this message by mistake and your location is not the US, kindly proceed to the website. Otherwise, you must leave the website in order to comply with government restrictions.

Why does your IP address show your location as the USA?

  • - you are using a VPN provided by a hosting company based in the United States;
  • - your IP does not have proper WHOIS records;
  • - an error occurred in the WHOIS geolocation database.

Please confirm whether you are a US resident or not by clicking the relevant button below. If you choose the wrong option, being a US resident, you will not be able to open an account with InstaForex anyway.

We are sorry for any inconvenience caused by this message.