empty
05.05.2025 06:07 AM
Trading Recommendations and Analysis for GBP/USD on May 5: The Dollar's Convulsions Continue

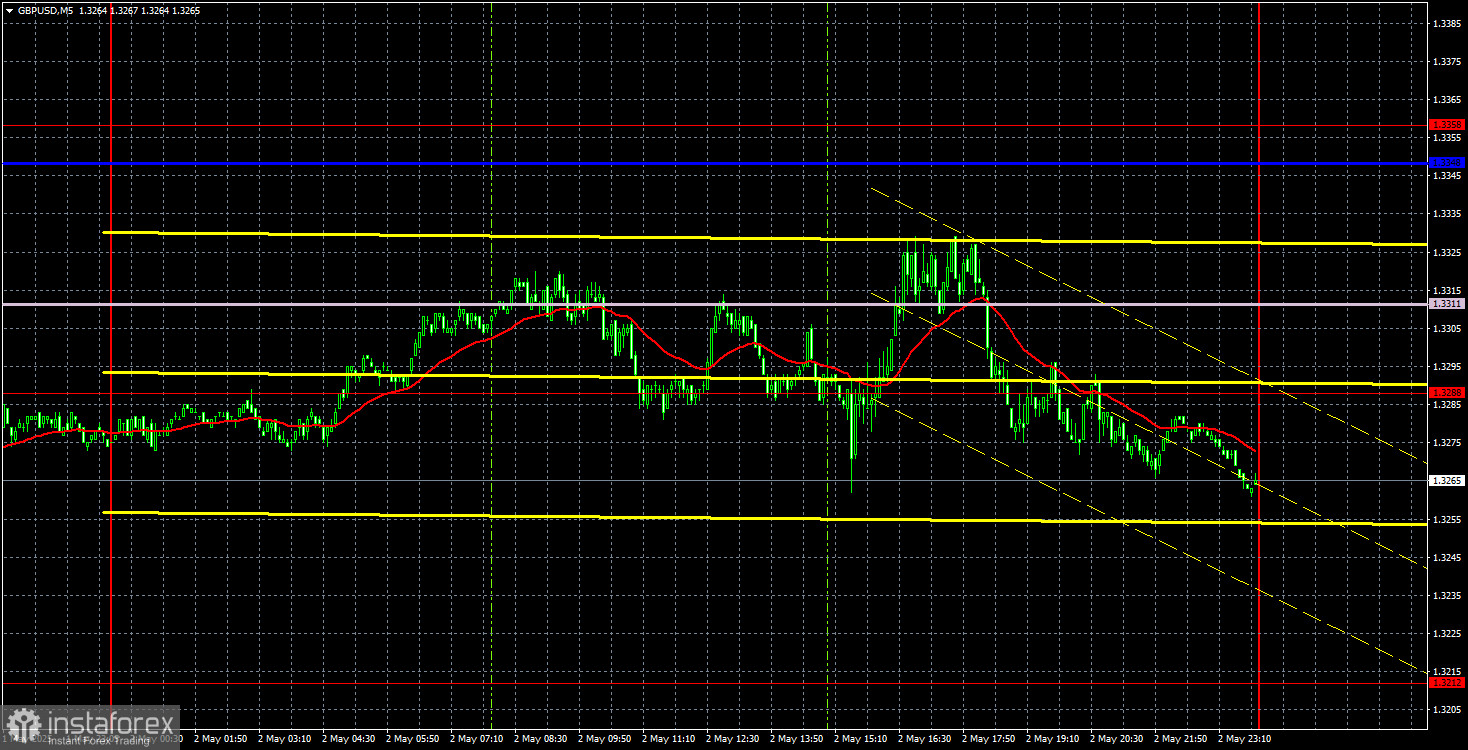
GBP/USD 5-Minute Analysis

This image is no longer relevant

On Friday, the GBP/USD currency pair corrected against Monday's growth and the broader uptrend. There were no clear reasons for the movements on any day of the week—Monday through Friday. Therefore, we believe that the market trades according to its rules, expectations, and instincts. Most of last week's U.S. macroeconomic data were disastrous, and Friday's data didn't do much to redeem the situation. If the U.S. dollar were currently showing a strong and confident rise, we might assume its "dark days" were behind it. However, what we're seeing is merely a technical correction. The market continues to ignore most macro and fundamental factors.

The key issue now is the unpredictability of Donald Trump's next moves. No one can say with certainty that the U.S. president won't introduce new tariffs. And if that's the case, then it's equally uncertain whether the dollar's decline is truly over. The only things the greenback can currently hope for are monetary policy easing from the Bank of England or Trump's tariff reductions (or reversals). A purely technical correction also remains a possibility.

From a technical perspective, Friday's movements didn't follow any predictable logic. As we've mentioned many times, the market is ignoring macroeconomic data and technical indicators. None of the levels or lines performed as expected during Friday's session. At this stage, we recommend opening trades only when clear and well-defined signals are formed.
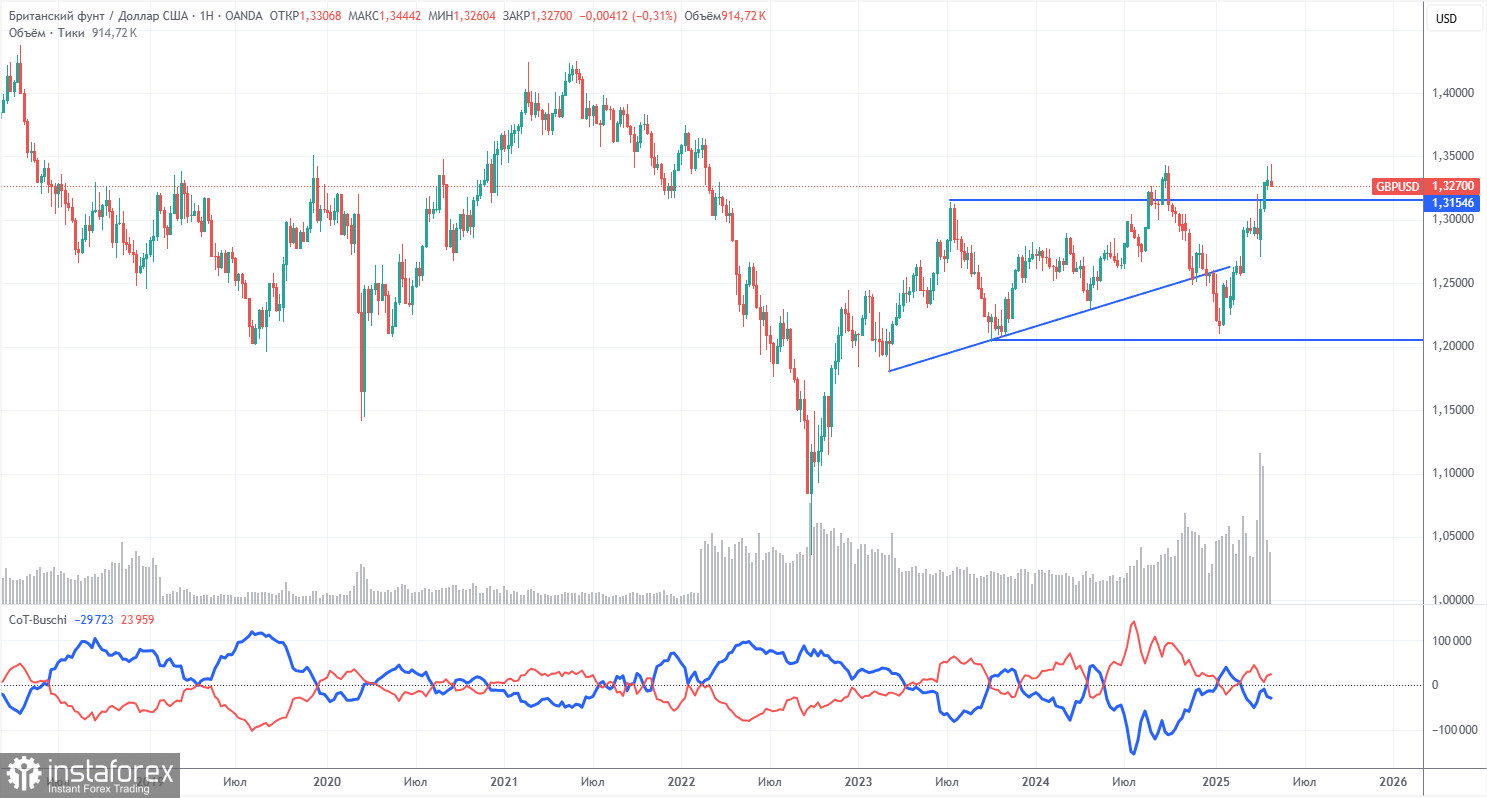
COT Report

This image is no longer relevant

COT reports for the British pound show that commercial traders' sentiment has constantly shifted in recent years. The red and blue lines—representing net positions of commercial and non-commercial traders—frequently intersect and mostly hover near the zero mark. That's the case now, indicating a relatively balanced number of long and short positions.

On the weekly timeframe, the price initially broke through the 1.3154 level, then surpassed the trend line, returned to 1.3154, and broke it again. Breaking the trend line suggests a high probability of further pound depreciation. However, the dollar continues to fall due to Donald Trump. Therefore, despite technical signals, news about the trade war could keep pushing the pound higher.

According to the latest report on the British pound, the "Non-commercial" group closed 2,900 BUY contracts and 6,400 SELL contracts. As a result, the net position of non-commercial traders increased by 3,500 contracts.

The fundamental backdrop still does not justify long-term buying of the pound sterling, and the currency remains at real risk of resuming a broader downtrend. The pound has gained significantly recently, but it's important to understand that this was due to Donald Trump's policies.

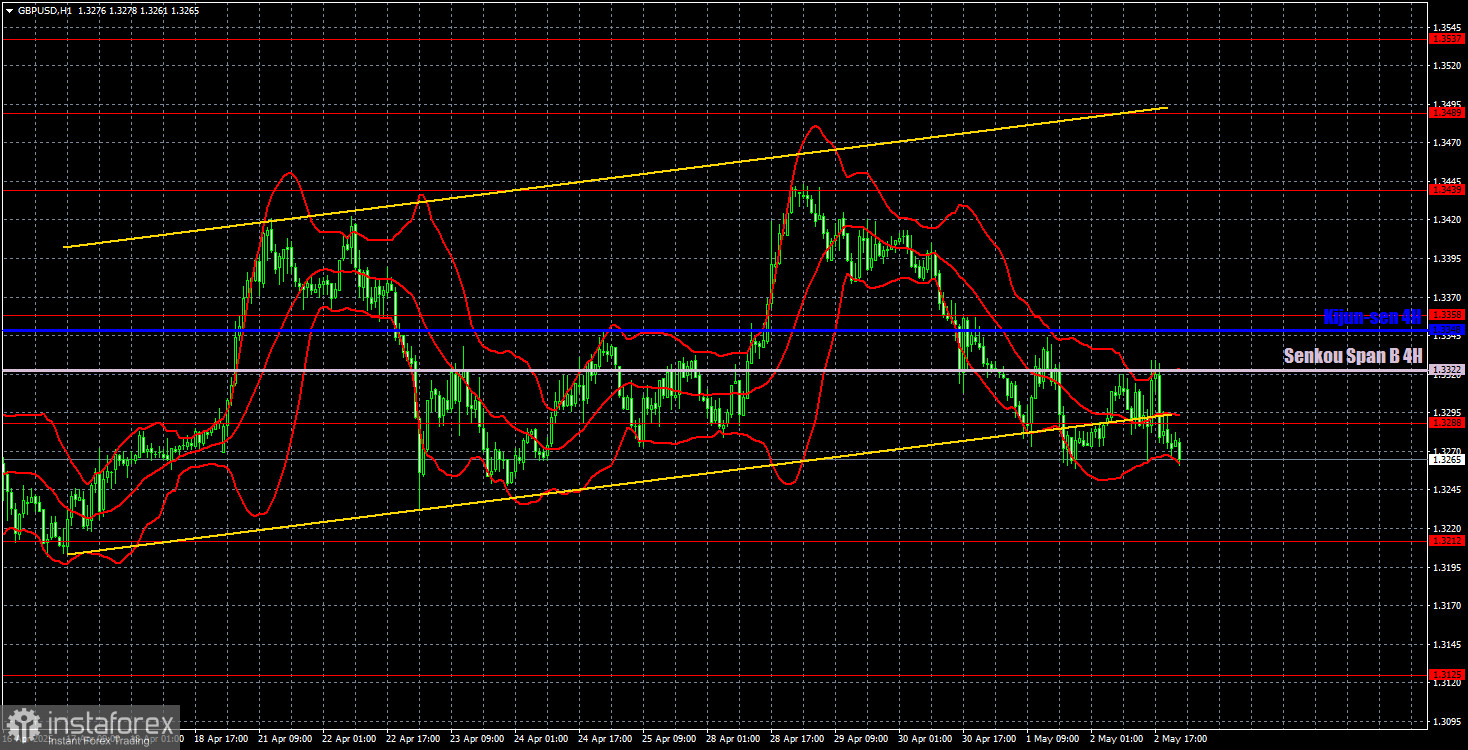
GBP/USD 1-Hour Analysis

This image is no longer relevant

In the hourly timeframe, GBP/USD continues its upward trend, though not as strongly as before, with occasional corrections. The pound has seen substantial growth in recent months, but it bears no credit—the entire move results from a falling dollar driven by Trump. And it's not over yet. The market pays no attention to macroeconomic data, and chaos and inconsistency persist with no logical structure to price movements.

The following levels are relevant for trading: 1.2691–1.2701, 1.2796–1.2816, 1.2863, 1.2981–1.2987, 1.3050, 1.3125, 1.3212, 1.3288, 1.3358, 1.3439, 1.3489, and 1.3537. Senkou Span B (1.3322) and Kijun-sen (1.3348) may also serve as sources of signals. A Stop Loss should be moved to breakeven if the price moves 20 pips in the right direction. Ichimoku indicator lines may shift during the day and should be monitored when determining signals.

No significant events or reports are scheduled for Monday in the UK, while the U.S. will release the ISM Services PMI. It's a fairly important indicator, but it would be no surprise if the market ignores it.

Illustration Explanations:

  • Support and resistance price levels – thick red lines where movement may end. They are not trading signal sources.
  • Kijun-sen and Senkou Span B lines—These are strong Ichimoku indicator lines transferred to the hourly timeframe from the 4-hour one.
  • Extremum levels – thin red lines where the price has previously rebounded. These act as trading signal sources.
  • Yellow lines – trend lines, trend channels, and other technical patterns.
  • COT Indicator 1 on the charts – the size of the net position for each category of traders.
Paolo Greco,
Analytical expert of InstaForex
© 2007-2025
Select timeframe
5
min
15
min
30
min
1
hour
4
hours
1
day
1
week
Earn on cryptocurrency rate changes with InstaForex
Download MetaTrader 4 and open your first trade
  • Grand Choice
    Contest by
    InstaForex
    InstaForex always strives to help you
    fulfill your biggest dreams.
    JOIN CONTEST

Recommended Stories

How to Trade the GBP/USD Pair on May 23? Simple Tips and Trade Analysis for Beginners

Analysis of Thursday's Trades 1H Chart of GBP/USD The GBP/USD pair didn't even attempt a correction on Thursday. While the euro faced bearish pressure from weak business activity indices

Paolo Greco 05:58 2025-05-23 UTC+2

How to Trade the EUR/USD Pair on May 23? Simple Tips and Trade Analysis for Beginners

Analysis of Thursday's Trades 1H Chart of EUR/USD On Thursday, the EUR/USD currency pair corrected to the nearest support level on the hourly timeframe, which was at 1.1267. Multiple factors

Paolo Greco 05:57 2025-05-23 UTC+2

Trading Recommendations and Analysis for GBP/USD on May 23: Pound Prepares for a Historic Breakout

The GBP/USD currency pair broke out of its sideways channel through the upper boundary, but it is in no hurry to continue rising. Traders appear to be gathering momentum

Paolo Greco 03:43 2025-05-23 UTC+2

Trading Recommendations and Analysis for EUR/USD on May 23: The Euro Couldn't Withstand the Pressure

On Thursday, the EUR/USD currency pair traded lower, which can be considered an exception to the general trend. Nearly all macroeconomic reports during the day were unfavorable for the euro

Paolo Greco 03:43 2025-05-23 UTC+2

How to Trade the GBP/USD Pair on May 22? Simple Tips and Trade Analysis for Beginners

Analysis of Wednesday's Trades 1H Chart of GBP/USD The GBP/USD pair maintained its upward trend on Wednesday, a movement that has developed over the past two weeks. Recall that

Paolo Greco 06:31 2025-05-22 UTC+2

How to Trade the EUR/USD Pair on May 22? Simple Tips and Trade Analysis for Beginners

Analysis of Wednesday's Trades 1H Chart of EUR/USD On Wednesday, the EUR/USD currency pair continued its upward movement calmly and steadily. The price broke through the 1.1267 level, which

Paolo Greco 06:31 2025-05-22 UTC+2

Trading Recommendations and Analysis for GBP/USD on May 22: The Pound Breaks Through Key Levels

The GBP/USD currency pair also resumed its upward movement on Wednesday. The rise of the British pound, which in reality still reflects the fall of the US dollar, began overnight

Paolo Greco 03:30 2025-05-22 UTC+2

Trading Recommendations and Analysis for EUR/USD on May 22: Reasons Don't Matter and Aren't Needed

The EUR/USD currency pair resumed its upward movement on Wednesday, and it is now safe to say that the uptrend is present not only in the hourly timeframe but also

Paolo Greco 03:30 2025-05-22 UTC+2

How to Trade the GBP/USD Pair on May 21? Simple Tips and Trade Analysis for Beginners

Analysis of Tuesday's Trades 1H Chart of GBP/USD The GBP/USD pair mainly traded sideways on Tuesday, but early Wednesday morning it surged upward. On the 4-hour timeframe, it's clear that

Paolo Greco 06:17 2025-05-21 UTC+2

How to Trade the EUR/USD Pair on May 21? Simple Tips and Trade Analysis for Beginners

Analysis of Tuesday's Trades 1H Chart of EUR/USD On Tuesday, the EUR/USD currency pair traded sideways, but it resumed its upward movement early Wednesday morning. This indicates that the ongoing

Paolo Greco 06:17 2025-05-21 UTC+2
Can't speak right now?
Ask your question in the chat.
Widget callback
 

Dear visitor,

Your IP address shows that you are currently located in the USA. If you are a resident of the United States, you are prohibited from using the services of InstaFintech Group including online trading, online transfers, deposit/withdrawal of funds, etc.

If you think you are seeing this message by mistake and your location is not the US, kindly proceed to the website. Otherwise, you must leave the website in order to comply with government restrictions.

Why does your IP address show your location as the USA?

  • - you are using a VPN provided by a hosting company based in the United States;
  • - your IP does not have proper WHOIS records;
  • - an error occurred in the WHOIS geolocation database.

Please confirm whether you are a US resident or not by clicking the relevant button below. If you choose the wrong option, being a US resident, you will not be able to open an account with InstaForex anyway.

We are sorry for any inconvenience caused by this message.