empty
25.03.2025 03:41 AM
Trading Recommendations and Analysis for GBP/USD on March 25: The Roller Coaster Continues

GBP/USD 5-Minute Analysis

This image is no longer relevant

The GBP/USD currency pair managed to move both upward and downward on Monday. We can't say that these movements were triggered by macroeconomic data, because they weren't. The UK's business activity indices were just as contradictory as the European, German, and U.S. figures. In any case, the pound began rising in the first half of the day well before those reports were released, and began falling in the second half of the day long before the U.S. data came out. Therefore, there's no correlation.

Like the euro, the British pound continues a sluggish, weak, and reluctant correction. The price barely managed to consolidate below the ascending channel, and just slightly broke below the Ichimoku indicator lines. From a technical standpoint, further decline is completely justified. Looking at the entire recent rise of the British currency, this correction seems even more logical. On the daily timeframe, there are simply no other scenarios. And on the monthly chart, the 16-year downtrend continues to form. The only problem is that the market doesn't want to buy the U.S. dollar—and that's solely due to Donald Trump's policy actions.

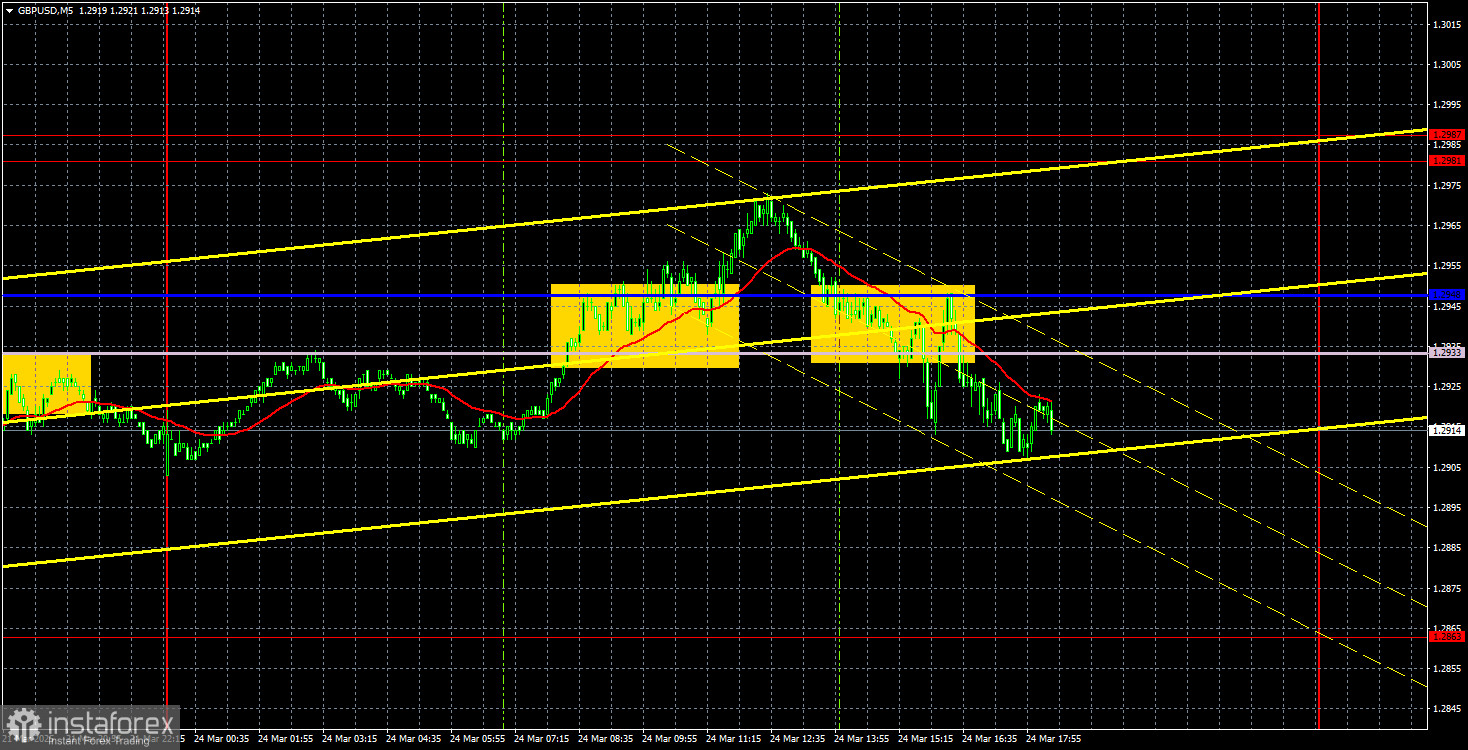
On the 5-minute timeframe, two trading signals were formed on Monday. First, the price broke through the Kijun-sen and Senkou Span B lines from bottom to top, and then from top to bottom. In the first case, the move in the right direction didn't even reach 20 pips. In the second case, it reached about 20. Thus, the second short trade could at best offset the loss from the first long trade. Volatility was again low, so it would have been difficult to profit from Monday's session regardless.

COT Report

This image is no longer relevant

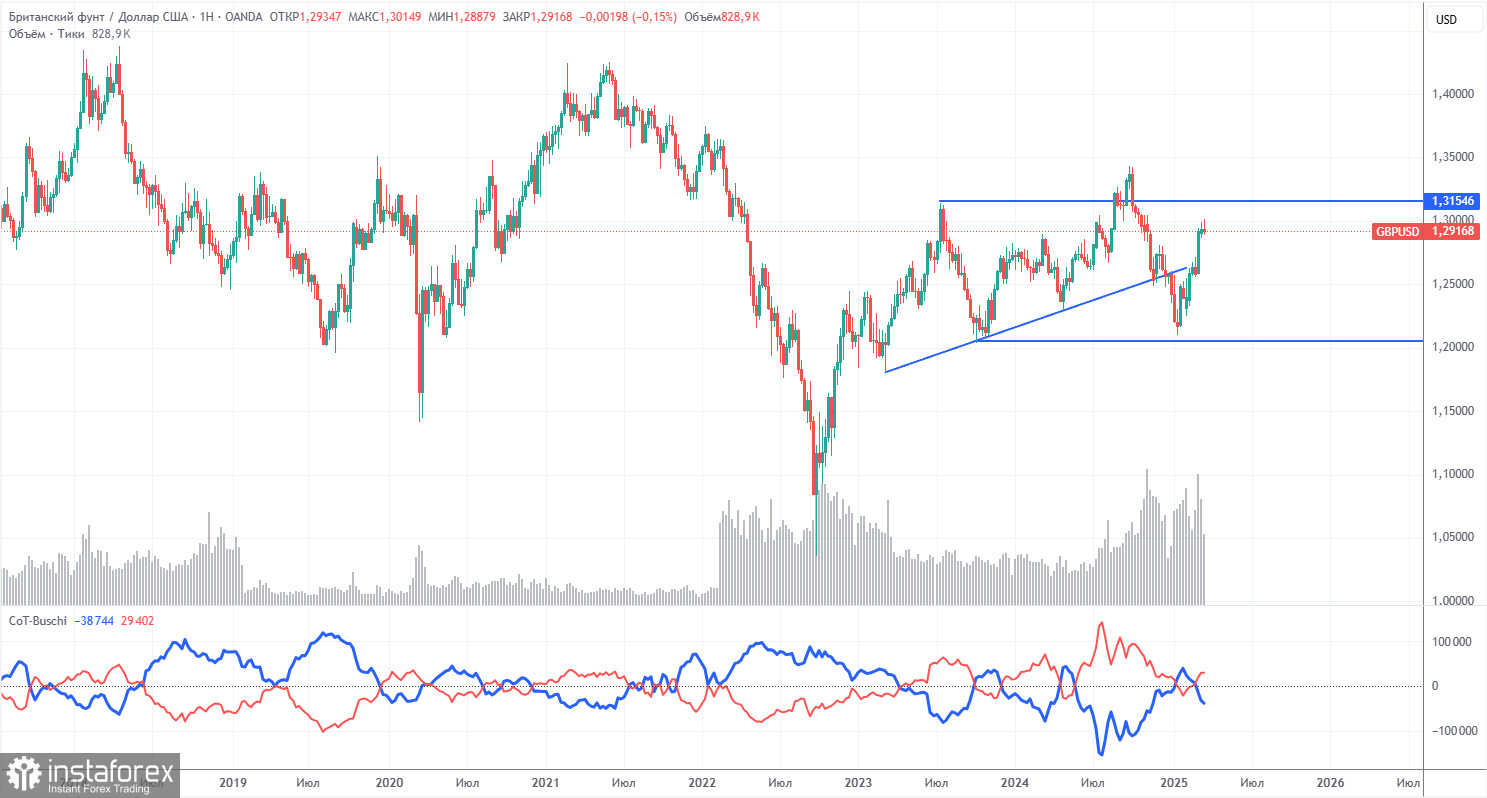
COT reports on the British pound show that commercial traders' sentiment has constantly changed in recent years. The red and blue lines, representing the net positions of commercial and non-commercial traders, intersect frequently and are mainly close to the zero level. They are also near each other, indicating that the number of long and short positions is roughly equal.

On the weekly chart, the price first broke the 1.3154 level and then dropped to the trendline, which it successfully breached. Breaking the trendline suggests that the pound is likely to continue falling. However, we should note a rebound from the second-to-last local low on the weekly chart. We may be dealing with a flat market.

According to the latest COT report on the British pound, the "Non-commercial" group opened 1,100 buy contracts and 900 sell contracts. As a result, the net position of non-commercial traders saw little change over the week.

The current fundamental backdrop does not support long-term buying of the pound, and the currency has a real possibility of continuing its global downward trend. The recent sharp increase in the pound's value can be attributed solely to Donald Trump's policies.

GBP/USD 1-Hour Analysis

This image is no longer relevant

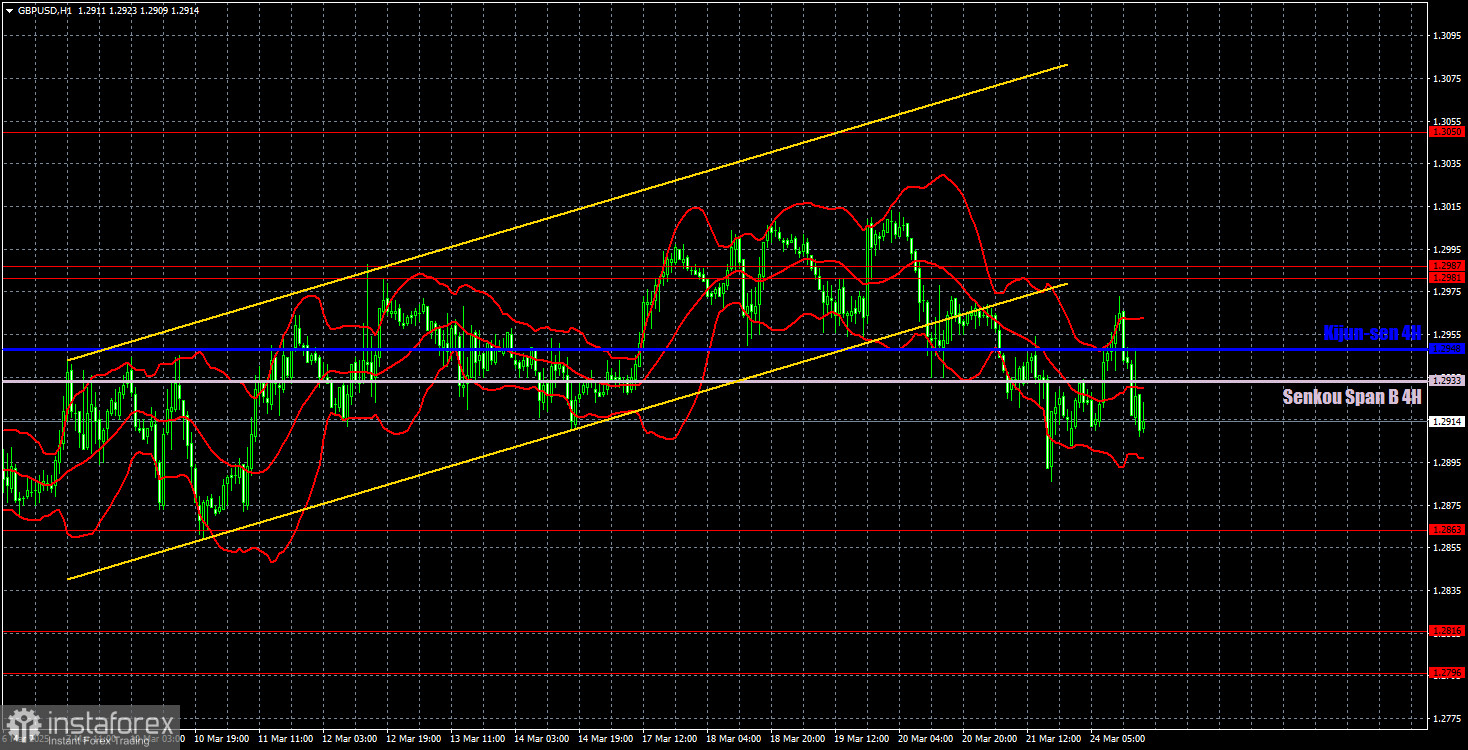
GBP/USD has started a downward trend on the hourly timeframe, though the decline has been weak. The upward correction on the daily timeframe is long overdue to end. We still don't see any reason for the pound to rise from a long-term perspective. Donald Trump's actions are currently the only factor supporting the pound—specifically, his imposed sanctions and tariffs left and right. The market is ignoring all other aspects.

For March 25, we highlight the following important levels: 1.2331–1.2349, 1.2429–1.2445, 1.2511, 1.2605–1.2620, 1.2691–1.2701, 1.2796–1.2816, 1.2863, 1.2981–1.2987, 1.3050, 1.3119. The Senkou Span B line (1.2933) and Kijun-sen line (1.2948) may also serve as signal sources. It is recommended to place a Stop Loss at breakeven when the price moves 20 pips in the right direction. Note that the Ichimoku indicator lines may shift throughout the day, which should be considered when identifying trading signals.

On Tuesday, no important or noteworthy events are scheduled in the UK, and only the New Home Sales report in the U.S. can be considered somewhat relevant. Thus, the macroeconomic background will be nearly absent. Therefore, high volatility is unlikely. A trending intraday move is also unlikely. The British pound will likely continue to drift downward in a sluggish correction.

Illustration Explanations:

  • Support and Resistance Levels (thick red lines): Thick red lines indicate where movement may come to an end. Please note that these lines are not sources of trading signals.
  • Kijun-sen and Senkou Span B Lines: Ichimoku indicator lines transferred from the 4-hour timeframe to the hourly timeframe. These are strong lines.
  • Extreme Levels (thin red lines): Thin red lines where the price has previously bounced. These serve as sources of trading signals.
  • Yellow Lines: Trendlines, trend channels, or any other technical patterns.
  • Indicator 1 on COT Charts: Represents the net position size for each category of traders.
Paolo Greco,
Analytical expert of InstaForex
© 2007-2025
Summary
Urgency
Analytic
Stanislav Polyanskiy
Start trade
Earn on cryptocurrency rate changes with InstaForex
Download MetaTrader 4 and open your first trade
  • Grand Choice
    Contest by
    InstaForex
    InstaForex always strives to help you
    fulfill your biggest dreams.
    JOIN CONTEST

Recommended Stories

How to Trade the GBP/USD Pair on July 23? Simple Tips and Trade Analysis for Beginners

Analysis of Tuesday's Trades 1H Chart of GBP/USD The GBP/USD pair also continued its upward movement on Tuesday. As expected, this did not require any news or reports. One could

Paolo Greco 06:51 2025-07-23 UTC+2

How to Trade the EUR/USD Pair on July 23? Simple Tips and Trade Analysis for Beginners

Analysis of Tuesday's Trades 1H Chart of EUR/USD On Tuesday, the EUR/USD currency pair continued its upward movement, as expected. Recall that the day before, the price consolidated above

Paolo Greco 06:51 2025-07-23 UTC+2

Trading Recommendations and Trade Breakdown for GBP/USD on July 23: The Lawful Uptrend Continues

On Tuesday, the GBP/USD currency pair also continued its upward movement. While the new decline of the U.S. dollar could be attributed to Jerome Powell's speech—as the only major event

Paolo Greco 03:33 2025-07-23 UTC+2

Trading Recommendations and Trade Breakdown for EUR/USD on July 23: The Predictable Decline of the Dollar Continues

On Tuesday, the EUR/USD currency pair remained flat for the first half of the day and then moved higher in the second half. During the U.S. session, Jerome Powell delivered

Paolo Greco 03:33 2025-07-23 UTC+2

How to Trade the GBP/USD Pair on July 22? Simple Tips and Trade Analysis for Beginners

Analysis of Monday's Trades 1H Chart of GBP/USD On Monday, the GBP/USD pair exhibited movements nearly identical to those of the EUR/USD pair. This suggests that the US dollar

Paolo Greco 06:39 2025-07-22 UTC+2

How to Trade the EUR/USD Pair on July 22? Simple Tips and Trade Analysis for Beginners

Analysis of Monday's Trades 1H Chart of EUR/USD On Monday, the EUR/USD currency pair is likely to have completed a three-week downward trend. As a reminder, over the past

Paolo Greco 06:39 2025-07-22 UTC+2

Trading Recommendations and Trade Breakdown for GBP/USD on July 22: The Pound Begins to Reverse the Trend

The GBP/USD currency pair also maintained an upward trajectory throughout Monday. The reasons were identical to those for EUR/USD. The dollar had been rising for three weeks on pure trader

Paolo Greco 03:45 2025-07-22 UTC+2

Trading Recommendations and Trade Breakdown for EUR/USD on July 22: The Dollar's Fairytale Is Over

On Monday, the EUR/USD currency pair continued its upward movement, which began last week. There were no local macroeconomic reasons for the euro's rise, but there were plenty of fundamental

Paolo Greco 03:45 2025-07-22 UTC+2

GBP/USD: Trading Plan for the European Session on July 21. Commitment of Traders (COT) Reports (Analysis of Yesterday's Trades). Pound Attempted to Recover

Last Friday, only one entry point into the market was formed. Let's look at the 5-minute chart and analyze what happened. In my morning forecast, I highlighted the 1.3442 level

Miroslaw Bawulski 08:12 2025-07-21 UTC+2

EUR/USD: Trading Plan for the European Session on July 21. Commitment of Traders (COT) Reports (Analysis of Yesterday's Trades). Euro Correction Is Nearing Its End

Only one market entry point was formed last Friday. Let's look at the 5-minute chart to see what happened. In my morning forecast, I highlighted the 1.1654 level

Miroslaw Bawulski 08:11 2025-07-21 UTC+2
Can't speak right now?
Ask your question in the chat.
Widget callback
 

Dear visitor,

Your IP address shows that you are currently located in the USA. If you are a resident of the United States, you are prohibited from using the services of InstaFintech Group including online trading, online transfers, deposit/withdrawal of funds, etc.

If you think you are seeing this message by mistake and your location is not the US, kindly proceed to the website. Otherwise, you must leave the website in order to comply with government restrictions.

Why does your IP address show your location as the USA?

  • - you are using a VPN provided by a hosting company based in the United States;
  • - your IP does not have proper WHOIS records;
  • - an error occurred in the WHOIS geolocation database.

Please confirm whether you are a US resident or not by clicking the relevant button below. If you choose the wrong option, being a US resident, you will not be able to open an account with InstaForex anyway.

We are sorry for any inconvenience caused by this message.