empty
13.02.2025 01:37 PM
GBP/USD: Trading Plan for the U.S. Session on February 13th (Analysis of Morning Trades)

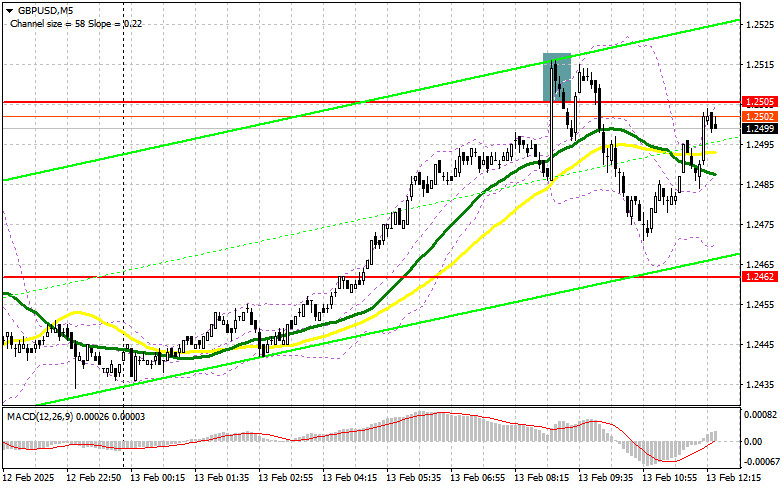
In my morning forecast, I focused on the 1.2505 level and planned to make trading decisions based on it. Let's examine the 5-minute chart to see what happened. A rise and false breakout at 1.2505 provided a strong short entry point, resulting in a 30+ point decline. The technical outlook has been revised for the second half of the session.

This image is no longer relevant

Long Position Strategy for GBP/USD:

News that UK GDP exceeded economists' forecasts triggered pound purchases, pushing GBP/USD to a new daily high. However, the rally quickly faded, as stronger economic growth may prompt further rate cuts by the Bank of England, which could negatively impact the pair's bullish prospects.

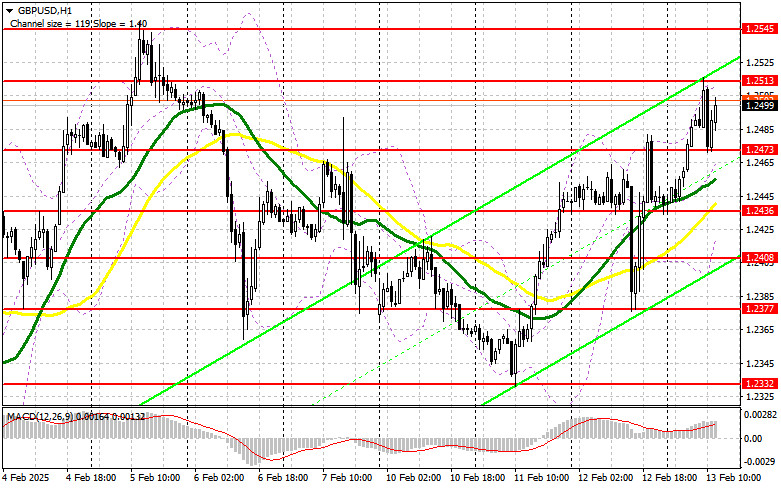
In the second half of the session, U.S. inflation data will be released, including the Producer Price Index (PPI) and core PPI. If these indicators rise, mirroring yesterday's trend, pressure on the pound will return, forcing buyers to defend the 1.2473 support level.

I will open long positions only after a false breakout at 1.2473, targeting 1.2513, a resistance level formed earlier in the day. A break and retest of this range will confirm a new buying opportunity, potentially pushing GBP/USD to 1.2545, reinforcing bullish prospects. The final target will be 1.2592, where I will lock in profits.

If GBP/USD falls and there is no buyer activity at 1.2473, the pressure on the pound will increase, though this will not yet be a major issue for buyers. In this case, a false breakout at 1.2436 will serve as a suitable entry for long positions. I also plan to buy immediately on a rebound from 1.2408, targeting a 30-35 point intraday correction.

Short Position Strategy for GBP/USD:

Sellers made their presence felt, signaling that they are not willing to give full control to the bulls. If GBP/USD attempts another rise, I will watch the 1.2513 resistance level for a false breakout, confirming a short position, aiming for 1.2473. Just below this level, the 30- and 50-period moving averages support the bulls.

A break and retest of 1.2473 from below will trigger stop-loss orders, opening the way to 1.2436. The final downward target will be 1.2408, where I will take profits.

If demand for the pound remains strong after U.S. inflation data, and sellers fail to act at 1.2513, GBP/USD will likely extend its rally. In that case, I will wait for a test of 1.2545 before entering short positions on a false breakout. If no bearish reaction occurs there, I will look for short entries around 1.2592, but only for a 30-35 point intraday correction.

This image is no longer relevant

Commitment of Traders (COT) Report Analysis:

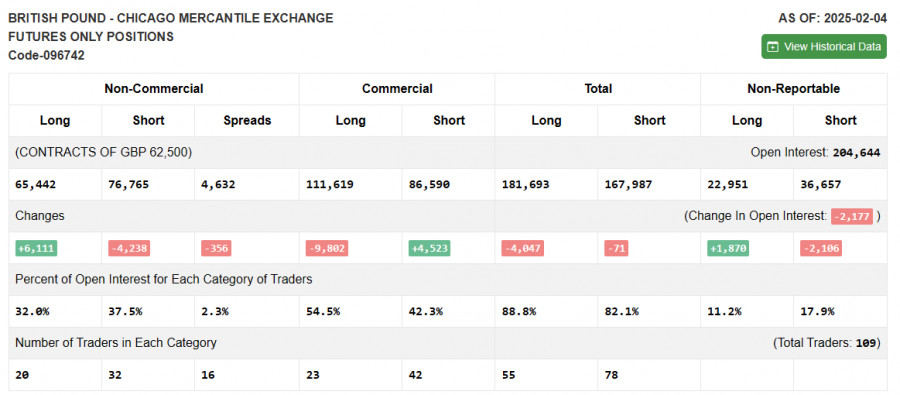
The February 4 COT report showed a decline in short positions and an increase in long positions. However, this should not be taken as a clear signal for pound appreciation.

This report does not yet reflect the Bank of England's rate cut decision and its increasingly dovish stance. The recent GBP rally was merely a correction, while the fundamental pressure on the pair remains. Additionally, new U.S. trade measures will continue to pressure risk assets, maintaining demand for the U.S. dollar. Long non-commercial positions increased by 6,111 to 65,442 Short non-commercial positions decreased by 4,238 to 76,765 The gap between long and short positions narrowed by 356.

This image is no longer relevant

Indicator Signals

Moving Averages

GBP/USD is trading above the 30- and 50-day moving averages, signaling potential further upside.

Note: The author uses H1 chart moving averages, which may differ from traditional daily moving averages on the D1 chart.

Bollinger Bands

If GBP/USD declines, the lower Bollinger Band near 1.2436 will serve as support.

Technical Indicator Descriptions:

  • Moving Average (MA) – identifies the current trend by smoothing out volatility and noise.
    • 50-period MA (yellow on the chart)
    • 30-period MA (green on the chart)
  • MACD (Moving Average Convergence/Divergence) – identifies trend momentum.
    • Fast EMA: 12-period
    • Slow EMA: 26-period
    • SMA: 9-period
  • Bollinger Bands (BB) – measures volatility and overbought/oversold conditions.
    • 20-period BB
  • Non-commercial traders – speculators, including retail traders, hedge funds, and institutional investors, using futures markets for speculative purposes.
  • Long non-commercial positions – total long open positions among non-commercial traders.
  • Short non-commercial positions – total short open positions among non-commercial traders.
  • Net non-commercial position – the difference between long and short positions of non-commercial traders.
Miroslaw Bawulski,
Analytical expert of InstaForex
© 2007-2025
GBPUSD
Great Britain Pound vs US Dollar
Summary
Buy
Urgency
1 day
Analytic
Maxim Magdalinin
Start trade
Earn on cryptocurrency rate changes with InstaForex
Download MetaTrader 4 and open your first trade
  • Grand Choice
    Contest by
    InstaForex
    InstaForex always strives to help you
    fulfill your biggest dreams.
    JOIN CONTEST

Recommended Stories

How to Trade the GBP/USD Pair on June 19? Simple Tips and Trade Analysis for Beginners

Analysis of Wednesday's Trades 1H Chart of GBP/USD On Wednesday, the GBP/USD pair spent most of the day in a minimal upward movement, clearly awaiting the outcome of the Federal

Paolo Greco 06:34 2025-06-19 UTC+2

How to Trade the EUR/USD Pair on June 19? Simple Tips and Trade Analysis for Beginners

Analysis of Wednesday's Trades 1H Chart of EUR/USD On Wednesday, the EUR/USD currency pair generally continued trading downward. However, the U.S. dollar only resumed its rise after the results

Paolo Greco 06:34 2025-06-19 UTC+2

Trading Recommendations and Analysis for GBP/USD on June 19: The First Stress Test Passed

On Wednesday, the GBP/USD currency pair recovered throughout the day following Tuesday's sharp decline. The drop in the British pound was likely linked to the possible involvement of the U.S

Paolo Greco 04:02 2025-06-19 UTC+2

Trading Recommendations and Analysis for EUR/USD on June 19: The Euro Prepares for a New Rally

As expected, the EUR/USD currency pair began recovering after Tuesday's decline. As previously noted in today's articles, we are not evaluating the outcome of the Federal Reserve meeting

Paolo Greco 04:02 2025-06-19 UTC+2

GBP/USD: Trading Plan for the U.S. Session on June 18th (Review of Morning Trades)

In my morning forecast, I focused on the 1.3472 level and planned to base market entries around it. Let's examine the 5-minute chart and analyze what happened. The upward move

Miroslaw Bawulski 18:37 2025-06-18 UTC+2

EUR/USD: Trading Plan for the U.S. Session on June 18th (Review of Morning Trades)

In my morning forecast, I highlighted the 1.1499 level and planned to base market entry decisions around it. Let's look at the 5-minute chart and break down what happened

Miroslaw Bawulski 18:34 2025-06-18 UTC+2

How to Trade the GBP/USD Pair on June 18? Simple Tips and Trade Analysis for Beginners

On Tuesday, the GBP/USD pair also showed a relatively strong decline in the second half of the day, which could only be attributed to factors that were impossible to predict

Paolo Greco 06:50 2025-06-18 UTC+2

How to Trade the EUR/USD Pair on June 18? Simple Tips and Trade Analysis for Beginners

Analysis of Tuesday's Trades 1H Chart of EUR/USD The EUR/USD currency pair experienced a significant decline on Tuesday, and it is puzzling to understand why the U.S. dollar unexpectedly strengthened

Paolo Greco 06:50 2025-06-18 UTC+2

Trading Recommendations and Analysis for GBP/USD on June 18: Pound Remains in a Flat Range

On Tuesday, the GBP/USD currency pair showed a relatively strong intraday decline, although there were no real reasons for it. In fact, the macroeconomic data from the U.S. was weak

Paolo Greco 03:56 2025-06-18 UTC+2

Trading Recommendations and Analysis for EUR/USD on June 18: The Dollar Rises Paradoxically

The EUR/USD currency pair unexpectedly rose during the U.S. trading session on Wednesday. The increase in the U.S. dollar was surprising, as there was no positive news to support it—quite

Paolo Greco 03:56 2025-06-18 UTC+2
Can't speak right now?
Ask your question in the chat.
Widget callback
 

Dear visitor,

Your IP address shows that you are currently located in the USA. If you are a resident of the United States, you are prohibited from using the services of InstaFintech Group including online trading, online transfers, deposit/withdrawal of funds, etc.

If you think you are seeing this message by mistake and your location is not the US, kindly proceed to the website. Otherwise, you must leave the website in order to comply with government restrictions.

Why does your IP address show your location as the USA?

  • - you are using a VPN provided by a hosting company based in the United States;
  • - your IP does not have proper WHOIS records;
  • - an error occurred in the WHOIS geolocation database.

Please confirm whether you are a US resident or not by clicking the relevant button below. If you choose the wrong option, being a US resident, you will not be able to open an account with InstaForex anyway.

We are sorry for any inconvenience caused by this message.