EUR/USD
Analysis:
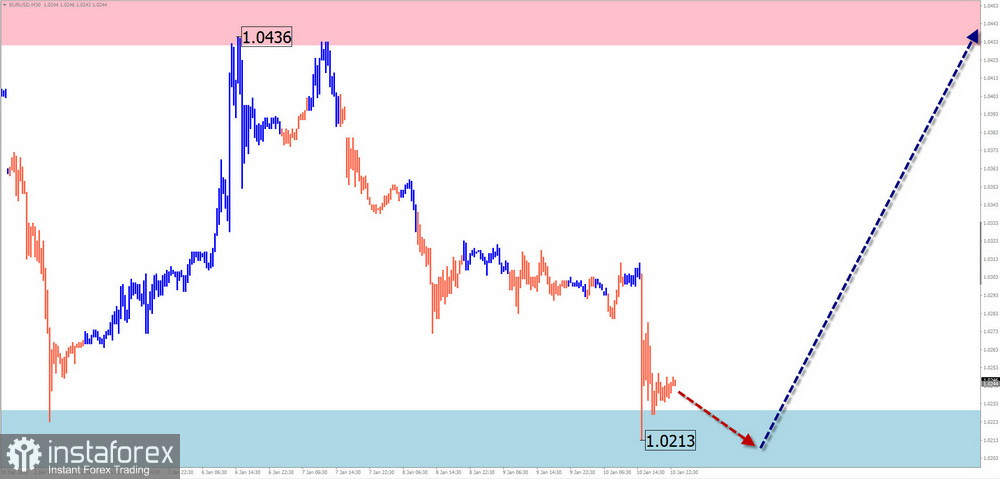
The bearish wave of the euro major, which began in August last year, has reached the upper boundary of the preliminary target zone. The structure of the entire wave does not appear to be complete as of this analysis. Since January 2, a bullish segment has been forming along this level.
Forecast:
In the coming days, the sideways movement of the euro is expected to continue. After a potential attempt to test the lower reversal zone, a directional shift and a price increase toward the resistance zone are anticipated. A temporary breakout below the calculated support boundary cannot be ruled out if the direction changes.
Potential Reversal Zones:
- Resistance: 1.0430/1.0480
- Support: 1.0230/1.0180
Recommendations:
- Sales: Risky and may result in deposit losses.
- Purchases: Possible only after confirmed reversal signals appear on your trading system (TS) in the support area.
USD/JPY
Analysis:
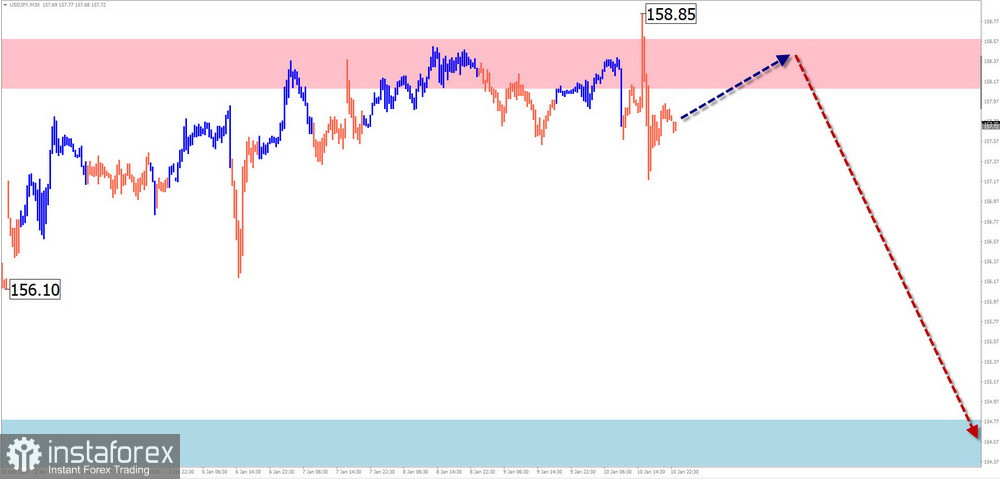
Since August last year, the Japanese yen major has predominantly moved upward, forming an extended ascending flat. Recently, a corrective pullback has been forming from the intermediate resistance zone, mostly in a sideways trajectory. The correction phase must fully complete before further price growth can resume.
Forecast:
The overall sideways price movement is likely to continue next week. Early in the week, there may be temporary pressure on the resistance zone, followed by a likely directional shift and the beginning of a decline. The support zone marks the lower boundary of the pair's preliminary weekly range.
Potential Reversal Zones:
- Resistance: 158.10/158.60
- Support: 154.80/154.30
Recommendations:
- Purchases: Risky and may result in deposit losses.
- Sales: Can be considered with a small lot after confirmed reversal signals.
GBP/JPY
Analysis:
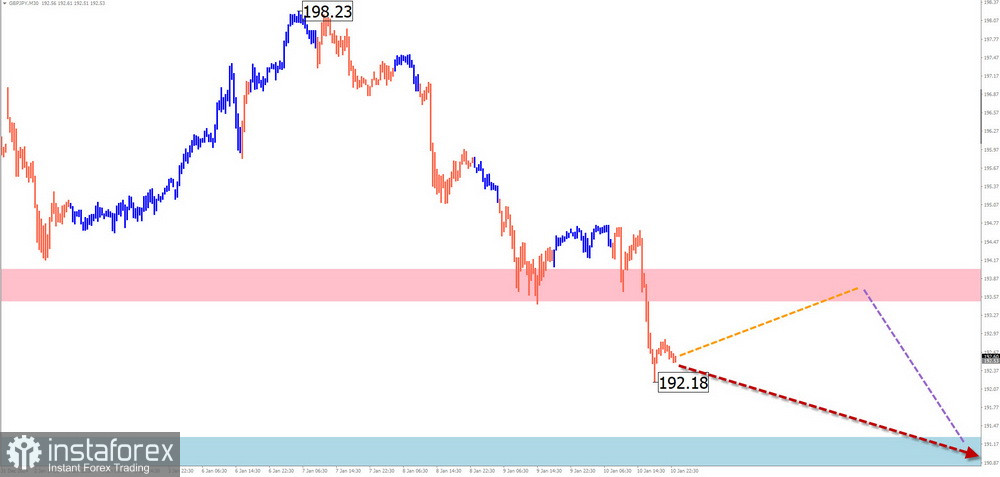
The bearish wave from December 7 last year dictates the short-term trend direction for the GBP/JPY pair. This movement segment has reversal potential, going beyond a correction of the previous primary wave segment. Currently, the price has broken through intermediate support, which has turned into resistance.
Forecast:
A continuation of the downward price vector is expected this week. Temporary pressure on the resistance zone may occur in the next couple of days. Increased volatility and the beginning of active price declines are more likely toward the end of the week.
Potential Reversal Zones:
- Resistance: 193.50/194.00
- Support: 191.30/190.80
Recommendations:
- Purchases: Risky and may incur losses.
- Sales: Can be used in trading after appropriate reversal signals near the resistance area.
USD/CAD
Analysis:
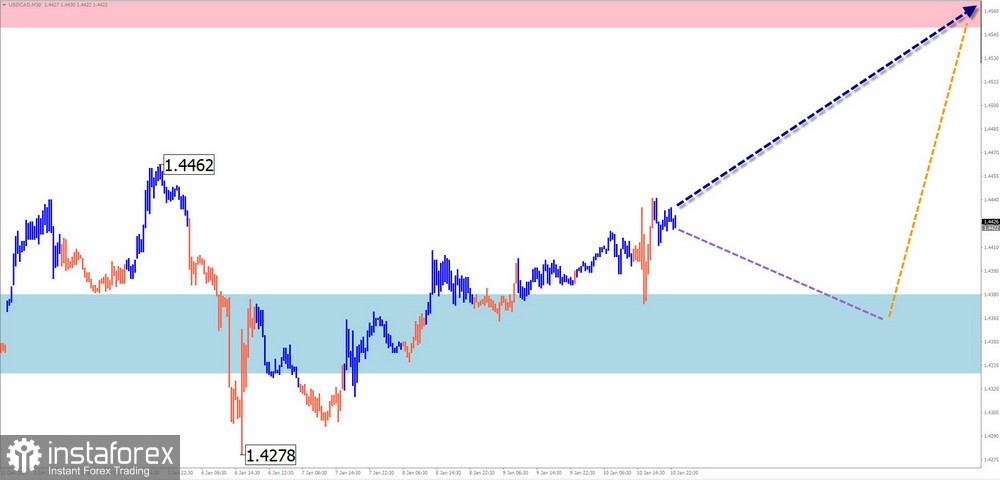
The primary price direction for the USD/CAD major has been dictated by an ascending wave since late September last year. A counterwave structure, remaining within correction boundaries, has been forming since the end of the year. The pair's quotes are now above the intermediate reversal zone, which has become support after being breached.
Forecast:
The sideways trend in price fluctuations is expected to persist early next week. Pressure on the support zone cannot be ruled out. Subsequently, a reversal is likely, and price growth toward the resistance area may resume.
Potential Reversal Zones:
- Resistance: 1.4550/1.4600
- Support: 1.4330/1.4280
Recommendations:
- Sales: Limited potential and high risk.
- Purchases: Viable after reversal signals appear near the calculated support area on your trading system.
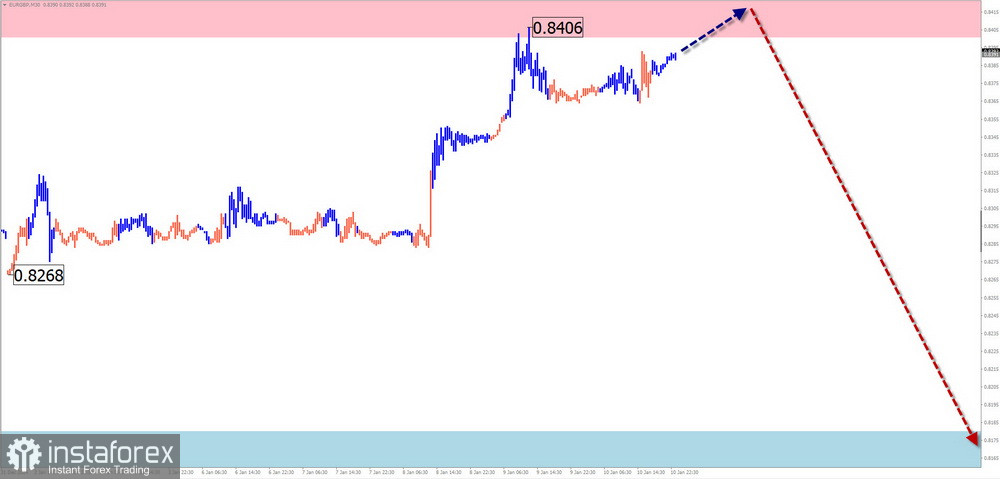
EUR/GBP
Analysis:
The current wave structure of the EUR/GBP pair began in August last year. Since October, sideways drifting has formed the correctional part (B), which remains incomplete. The pair's quotes are confined to a narrow range between significant daily timeframe reversal zones.
Forecast:
An upward movement is expected to continue in the coming days. Near the resistance zone, a reversal and a renewed downward movement are anticipated. The highest activity is likely toward the weekend.
Potential Reversal Zones:
- Resistance: 0.8400/0.8450
- Support: 0.8180/0.8130
Recommendations:
- Sales: Viable after appropriate reversal signals appear near the resistance zone with a small lot.
- Purchases: Unpromising and highly risky.
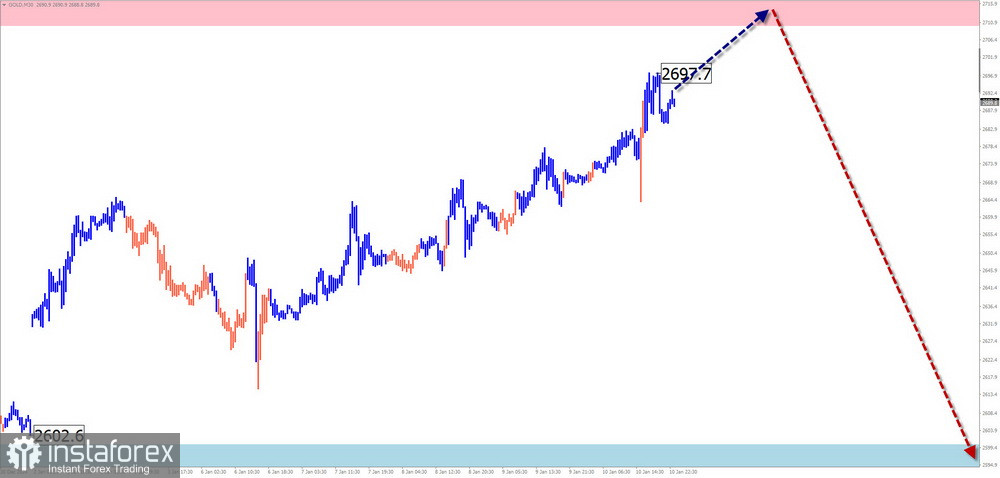
Gold
Analysis:
Since late October last year, a counterwave has been forming on the gold chart from record highs. This section forms a correction within a larger wave structure. Lines drawn through the extrema on the gold chart reveal a "horizontal pennant" price pattern, which remains incomplete as of this analysis.
Forecast:
The overall sideways trend is expected to continue next week. Initial pressure on the resistance zone is likely. Subsequently, a reversal and downward movement are anticipated. The calculated support level limits the expected range of the instrument's decline.
Potential Reversal Zones:
- Resistance: 2710.0/2730.0
- Support: 2600.0/2580.0
Recommendations:
- Purchases: Limited potential and high risk.
- Sales: Possible after reversal signals appear near the calculated support area using your trading system.
Explanations:
In simplified wave analysis (SWA), all waves consist of three parts (A-B-C). The analysis focuses on the last, incomplete wave at each timeframe. Dashed lines indicate expected movements.
Note: The wave algorithm does not account for the duration of instrument movements over time.