empty
12.09.2024 03:47 PM
EUR/USD: Trading Plan for the U.S. Session on September 12 (Analysis of Morning Trades)

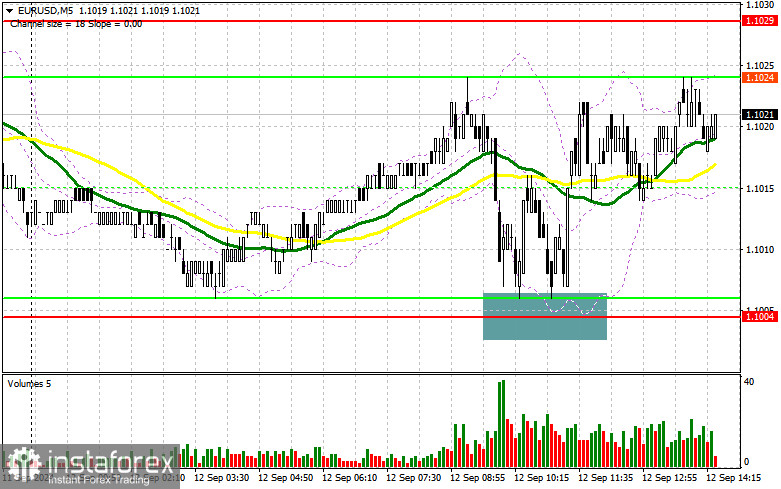
In my morning forecast, I highlighted the 1.1004 level and planned to make trading decisions based on it. Let's review the 5-minute chart to analyze the developments. A decline followed by a false breakout at this level led to a buying opportunity, resulting in a 20-point rise before demand for the euro decreased. The technical outlook for the second half of the day remains unchanged.

This image is no longer relevant

To open long positions on EUR/USD:

I discussed the market's reaction to today's European Central Bank decision in my morning forecast, so there's no need to reiterate it. In addition to the ECB's decision, there's also interesting U.S. data related to inflation. A steeper-than-expected decline in the Producer Price Index (PPI) could prompt the Federal Reserve to consider more aggressive monetary policy easing. If inflation aligns with economists' forecasts, similar to yesterday's consumer price data, or if it rises, pressure on EUR/USD is likely to increase. I plan to enter after a decline and a false breakout near the 1.1004 level – the weekly low. The target will be a correction to 1.1029 resistance, above which the pair has struggled to break. A breakout followed by a retest of this area would lead to a rise, with the chance to test 1.1052. The final target will be 1.1072, where I will close positions. If EUR/USD drops and fails to show significant activity near 1.1004 in the second half of the day, sellers will retain control, leading to a larger sell-off. In this case, I will open positions only after a false breakout at the next support at 1.0979. I plan to open long positions from 1.0952 on a rebound, targeting a 30-35 point upward correction during the day.

To open short positions on EUR/USD:

Sellers made their presence known in the first half of the day, but a major sell-off didn't occur. If the euro rises following U.S. data, a false breakout around 1.1029 will provide an opportunity to open short positions, targeting the 1.1004 support – the weekly low. A breakout and consolidation below this range, especially with higher U.S. inflation, will offer another selling point, aiming for 1.0979. The final target will be 1.0952, which would invalidate all buyers' short-term growth plans for the euro. I will take profits there. If EUR/USD rises and bears fail to appear at 1.1029, where moving averages favor sellers, buyers will have a chance to test the 1.1052 resistance. I will sell there after a failed consolidation. I plan to open short positions upon a rebound from 1.1072, aiming for a 30-35 point downward correction.

This image is no longer relevant

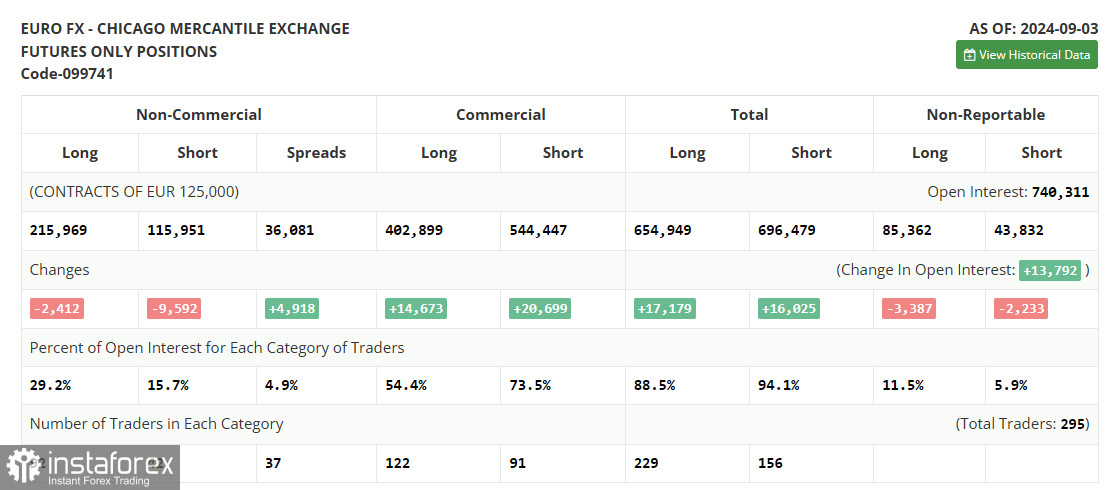
In the COT (Commitment of Traders) report for September 3, there was a reduction in both long and short positions. Despite a significant drop in euro sellers, it did not affect the pair's bearish technical outlook. The euro is likely to continue weakening against the dollar this week, as the upcoming ECB meeting is expected to reveal another rate cut in the Eurozone and further monetary policy changes. However, this doesn't cancel the euro's medium-term uptrend, and the lower the pair goes, the more attractive it becomes for buying. The COT report shows that long non-commercial positions decreased by 2,412 to 215,969, while short non-commercial positions dropped by 9,592 to 115,951. As a result, the gap between long and short positions widened by 4,918.

This image is no longer relevant

Indicator Signals:

Moving Averages

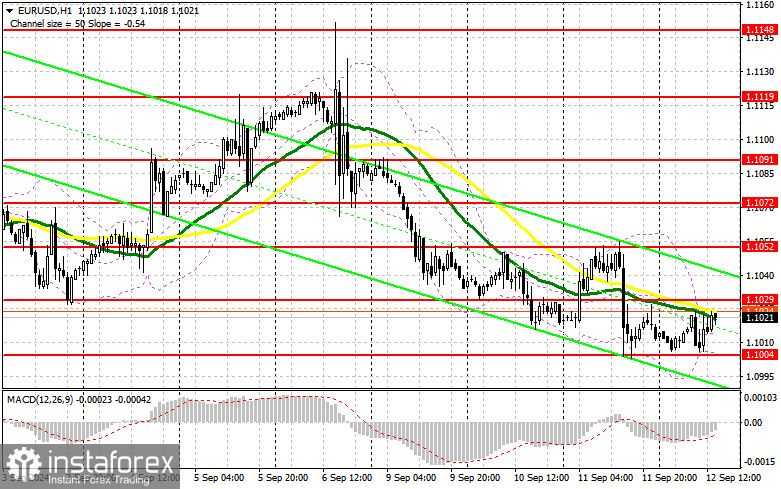
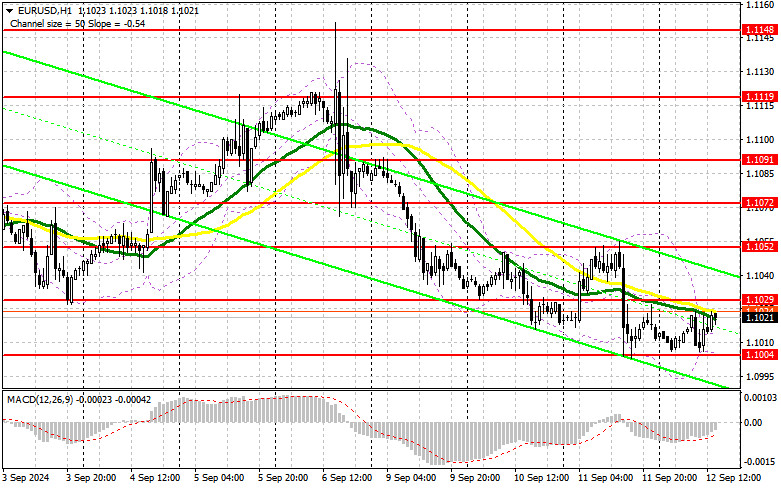
Trading is happening slightly below the 30- and 50-day moving averages, indicating market equilibrium.

Note: The period and prices of the moving averages are considered by the author on the H1 chart and may differ from the definition of classic daily moving averages on the D1 chart.

Bollinger Bands

In case of a decline, the lower boundary of the indicator around 1.1029 will act as support.

Description of Indicators:• Moving average: Determines the current trend by smoothing volatility and noise. Period 50, marked in yellow on the chart.• Moving average: Determines the current trend by smoothing volatility and noise. Period 30, marked in green on the chart.• MACD indicator (Moving Average Convergence/Divergence): Fast EMA period 12, Slow EMA period 26, SMA period 9.• Bollinger Bands: Period 20.• Non-commercial traders: Speculators, such as individual traders, hedge funds, and large institutions using the futures market for speculative purposes.• Long non-commercial positions: Total long open positions of non-commercial traders.• Short non-commercial positions: Total short open positions of non-commercial traders.• Total non-commercial net position: The difference between short and long positions of non-commercial traders.

Miroslaw Bawulski,
Analytical expert of InstaForex
© 2007-2025
Summary
Urgency
Analytic
Maxim Magdalinin
Start trade
Earn on cryptocurrency rate changes with InstaForex
Download MetaTrader 4 and open your first trade
  • Grand Choice
    Contest by
    InstaForex
    InstaForex always strives to help you
    fulfill your biggest dreams.
    JOIN CONTEST

Recommended Stories

How to Trade the GBP/USD Pair on August 22? Simple Tips and Trade Analysis for Beginners

Analysis of Thursday's Trades 1H Chart of GBP/USD On Thursday, the GBP/USD pair continued a mild downward movement, supported by two descending trendlines. The downward correction in the pound looks

Paolo Greco 06:45 2025-08-22 UTC+2

How to Trade the EUR/USD Pair on August 22? Simple Tips and Trade Analysis for Beginners

Analysis of Thursday's Trades 1H Chart of EUR/USD On Thursday, the EUR/USD pair continued a very weak downward move, which looks more like a flat than a trend. We have

Paolo Greco 06:45 2025-08-22 UTC+2

Trading Recommendations and Trade Breakdown for GBP/USD on August 22: Correction Continues

On Thursday, the GBP/USD pair continued a weak downward move, which is corrective in nature. The British pound began to decline on August 14, a week ago. During this time

Paolo Greco 04:19 2025-08-22 UTC+2

Trading Recommendations and Trade Breakdown for EUR/USD on August 22. No Downtrend!

The EUR/USD pair spent most of Thursday trading in a "neither fish nor fowl" style. Yes, in the second half of the day, we finally saw something resembling a move

Paolo Greco 04:19 2025-08-22 UTC+2

How to Trade the GBP/USD Pair on August 21? Simple Tips and Trade Analysis for Beginners

Analysis of Wednesday's Trades 1H Chart of GBP/USD On Wednesday, the GBP/USD pair continued a weak downward movement, which is based purely on technical factors. While there was no macroeconomic

Paolo Greco 07:35 2025-08-21 UTC+2

How to Trade the EUR/USD Pair on August 21? Simple Tips and Trade Analysis for Beginners

Analysis of Wednesday's Trades 1H Chart of EUR/USD On Wednesday, the EUR/USD currency pair continued to move with minimal volatility and without a clear direction. More precisely, there

Paolo Greco 07:35 2025-08-21 UTC+2

Trading Recommendations and Trade Breakdown for GBP/USD on August 21: The Pound Continues to Correct

On Wednesday, the GBP/USD pair continued a weak downward move, which has a corrective character. The price consolidated below the ascending trendline, so the decline was expected. A decline

Paolo Greco 04:16 2025-08-21 UTC+2

Trading Recommendations and Trade Breakdown for EUR/USD on August 21: Flat Continues

The EUR/USD pair on Wednesday continued trading within the same flat range as in the previous days. Volatility is shrinking day by day, so now the working range is limited

Paolo Greco 04:16 2025-08-21 UTC+2

How to Trade the GBP/USD Pair on August 20? Simple Tips and Trade Analysis for Beginners

Analysis of Tuesday's Trades 1H Chart of GBP/USD On Tuesday, the GBP/USD pair traded with a slight decline, which was not triggered by any events or reports. The ascending trendline

Paolo Greco 06:59 2025-08-20 UTC+2

How to Trade the EUR/USD Pair on August 20? Simple Tips and Trade Analysis for Beginners

Analysis of Tuesday's Trades 1H Chart of EUR/USD On Tuesday, the EUR/USD pair traded intraday in both directions with minimal volatility. The macroeconomic and fundamental background remains absent, leaving

Paolo Greco 06:59 2025-08-20 UTC+2
Can't speak right now?
Ask your question in the chat.
Widget callback
 

Dear visitor,

Your IP address shows that you are currently located in the USA. If you are a resident of the United States, you are prohibited from using the services of InstaFintech Group including online trading, online transfers, deposit/withdrawal of funds, etc.

If you think you are seeing this message by mistake and your location is not the US, kindly proceed to the website. Otherwise, you must leave the website in order to comply with government restrictions.

Why does your IP address show your location as the USA?

  • - you are using a VPN provided by a hosting company based in the United States;
  • - your IP does not have proper WHOIS records;
  • - an error occurred in the WHOIS geolocation database.

Please confirm whether you are a US resident or not by clicking the relevant button below. If you choose the wrong option, being a US resident, you will not be able to open an account with InstaForex anyway.

We are sorry for any inconvenience caused by this message.