empty
22.08.2024 01:51 PM
EUR/USD. August 22. Business activity index cools down buyer enthusiasm

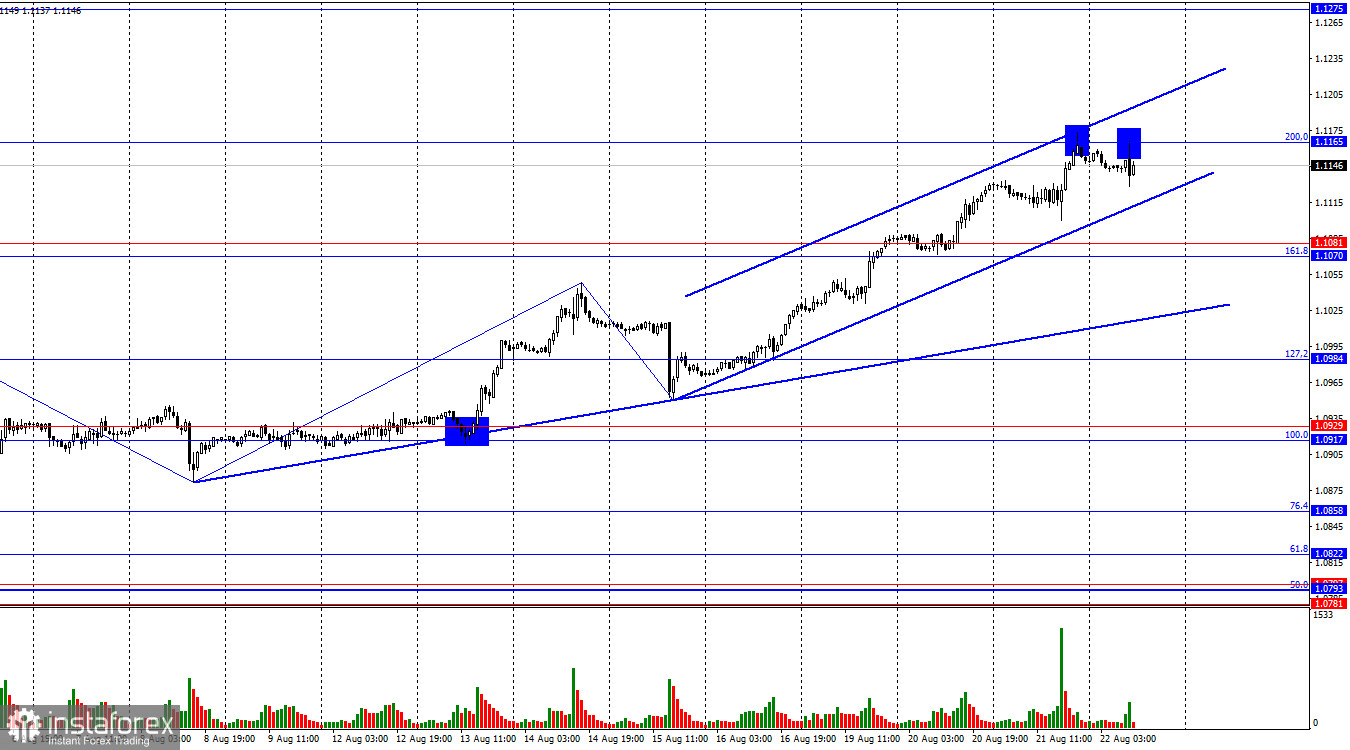
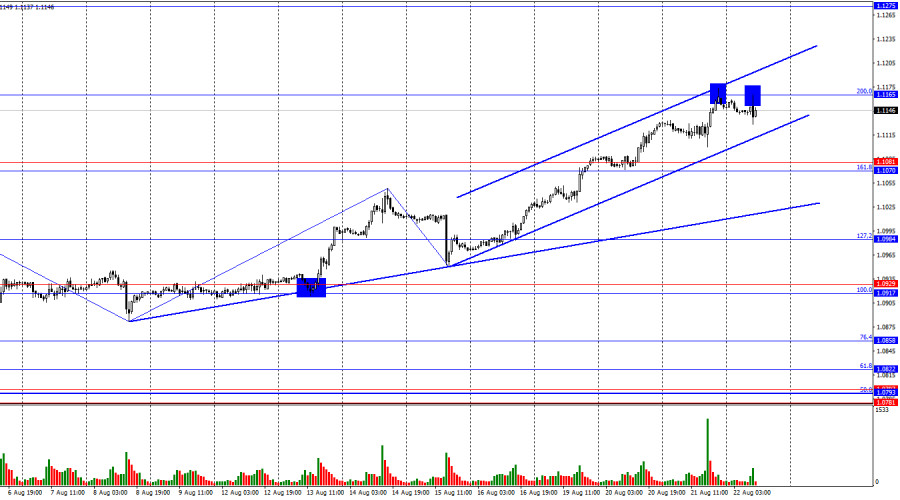
On Wednesday, the EUR/USD pair rose to the 200.0% corrective level at 1.1165. Two rejections from this level currently suggest a possible reversal in favor of the U.S. dollar and a slight decline toward the support zone of 1.1070–1.1081. However, it is not certain that the price will manage to consolidate below the upward trend channel, as the "bullish" trend remains very strong. The pair's growth would likely have continued this morning if the Eurozone business activity indices hadn't been weaker than expected. Consolidation above the 1.1165 level would signal a further rise toward the next Fibonacci level of 261.8% at 1.1318.

This image is no longer relevant

The wave situation has become a bit more complex but remains clear overall. The last completed downward wave did not break the low of the previous wave, while the new upward wave broke the peak from August 14. Thus, the "bullish" trend is still intact. For the "bullish" trend to be invalidated, the bears would need to break the low of the last downward wave, which is near the 1.0950 level.

The news flow on Wednesday was nearly nonexistent. Only in the second half of the day did the new Nonfarm Payrolls report (in annual terms) come in weaker than market expectations, triggering a new decline in the U.S. dollar. However, in my view, the decline of the U.S. currency would have continued even without this report, just as it did on Monday or Tuesday. This morning, business activity reports were released in Germany and the Eurozone. Three out of four indicators were weaker than expected. The only positive was the Eurozone services PMI, which rose from 51.9 to 53.3 points. As we can see, the impact of this information was only enough to pause the continuous growth. I don't believe that this pause marks the end. Typically, trends end abruptly, and we are not seeing any sharp reversals at the moment.

This image is no longer relevant

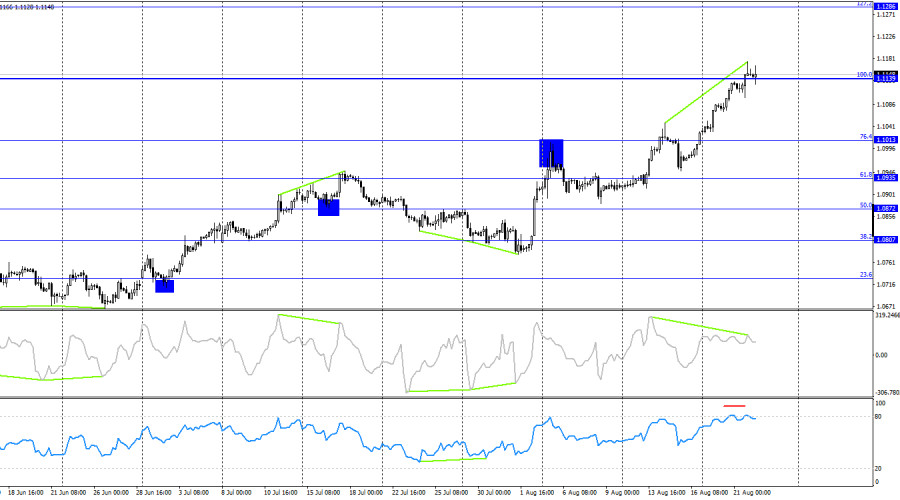
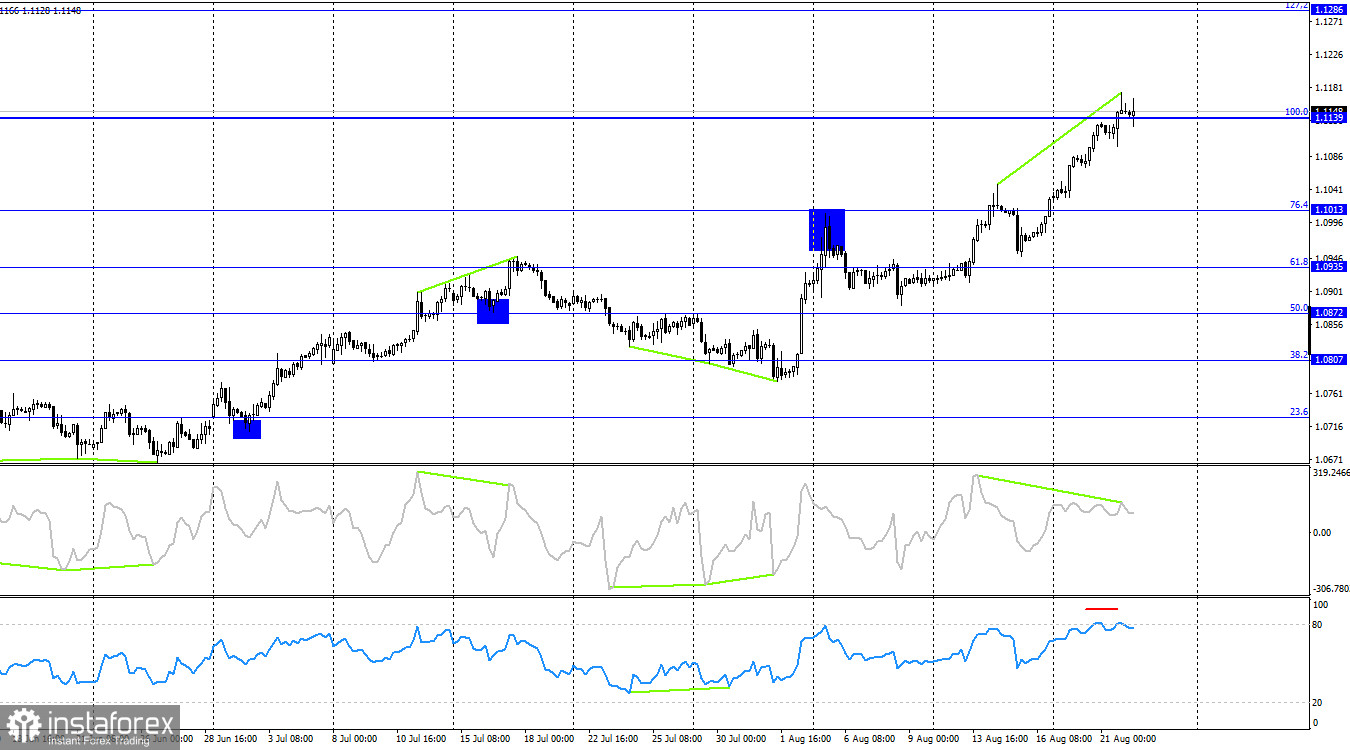
On the 4-hour chart, the pair rose to the 100.0% Fibonacci level at 1.1139 and held just above it. The CCI indicator has been signaling a "bearish" divergence for several days, and the RSI is in overbought territory. Thus, many factors suggest a potential decline in the pair by the end of the week. However, significant growth for the dollar seems unlikely at this point. Even if a downward trend begins, it will take quite some time to obtain the necessary confirmations. For now, I only anticipate a slight downward correction.

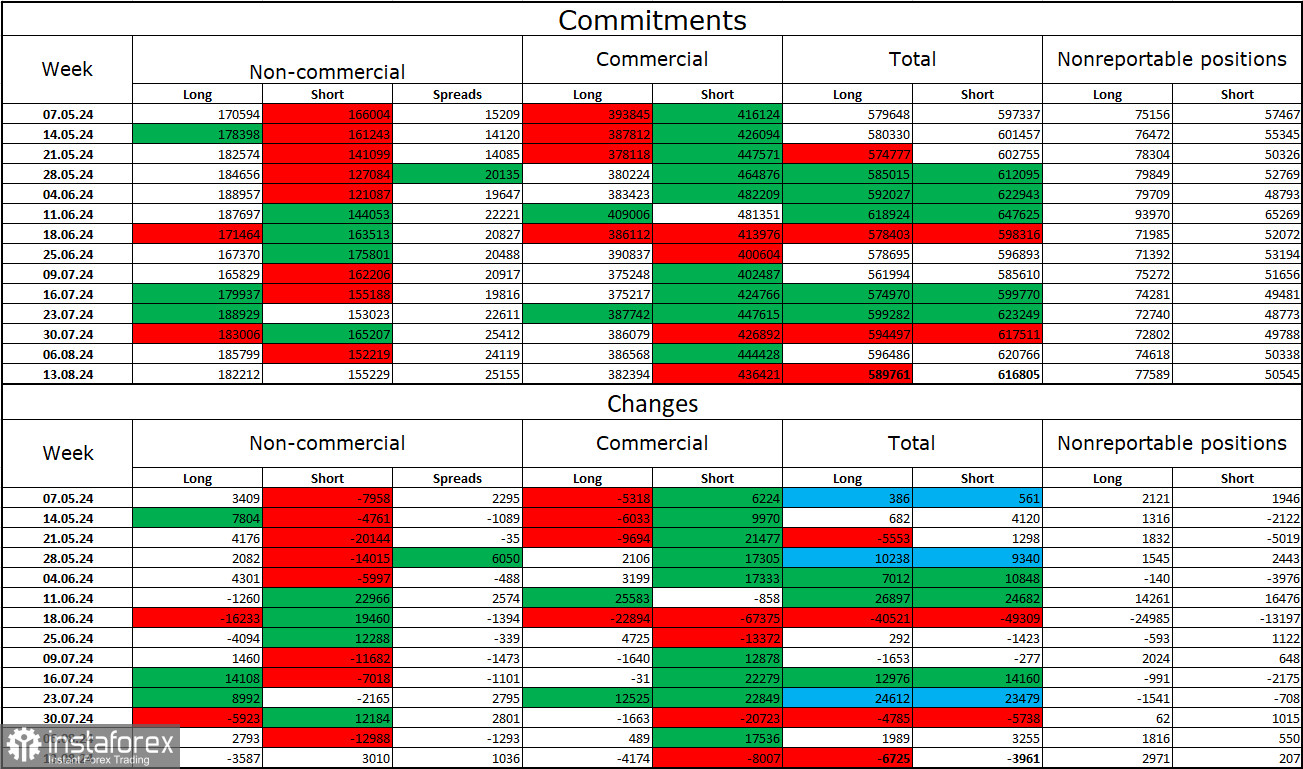
Commitments of Traders (COT) Report:

This image is no longer relevant

During the last reporting week, speculators closed 3,587 long positions and opened 3,010 short positions. The sentiment of the "Non-commercial" group turned "bearish" several months ago, but bulls have regained dominance. The total number of long positions held by speculators is now 182,000, while short positions total 155,000.

I still believe that the situation will continue to shift in favor of the bears. I see no long-term reasons to buy the euro, as the ECB's monetary easing will reduce yields on bank deposits and government bonds. In the U.S., yields are likely to remain high at least until September, making the dollar more attractive to investors. The potential for a euro decline is significant. However, one should not overlook the technical analysis, which currently does not suggest a strong fall for the euro.

News Calendar for the U.S. and Eurozone:

  • Eurozone – Germany Manufacturing PMI (07:30 UTC)
  • Eurozone – Germany Services PMI (07:30 UTC)
  • Eurozone – Manufacturing PMI (08:00 UTC)
  • Eurozone – Services PMI (08:00 UTC)
  • U.S. – Initial Jobless Claims (12:30 UTC)
  • U.S. – Manufacturing PMI (13:45 UTC)
  • U.S. – Services PMI (13:45 UTC)

On August 22, the economic calendar contains a significant number of entries. The impact of the information background on trader sentiment will be notable for the first time this week.

Forecast for EUR/USD and Trading Tips:

Selling the pair today can be considered on a rebound from the 1.1165 level on the hourly chart, targeting 1.1070–1.1081. Purchases were possible upon closing above the 1.1080 level on the hourly chart with a target of 1.1140, which was reached. New long positions can be considered upon the formation of buy signals near the levels of 1.1070–1.1081 or 1.1165 on the hourly chart.

Fibonacci grids are constructed from 1.0917–1.0668 on the hourly chart and from 1.1139–1.0603 on the 4-hour chart.

Samir Klishi,
Analytical expert of InstaForex
© 2007-2025
Select timeframe
5
min
15
min
30
min
1
hour
4
hours
1
day
1
week
Earn on cryptocurrency rate changes with InstaForex
Download MetaTrader 4 and open your first trade
  • Grand Choice
    Contest by
    InstaForex
    InstaForex always strives to help you
    fulfill your biggest dreams.
    JOIN CONTEST

Recommended Stories

XAU/USD. Analysis and Forecast

Gold is rising today as investors remain on edge amid uncertainty surrounding trade tariffs, fiscal challenges in the U.S., and geopolitical risks—factors that support demand for safe-haven assets. Additionally, expectations

Irina Yanina 18:23 2025-05-28 UTC+2

Trading Signals for EUR/USD for May 28-30, 2025: sell below 1.1350 (200 EMA - 21 SMA)

Early in the American session, the euro is trading around 1.1320 within the uptrend channel formed on the H4 chart since May 9 and showing signs of exhaustion

Dimitrios Zappas 18:02 2025-05-28 UTC+2

Trading Signals for GOLD (XAU/USD) for May 28-30, 2025: sell below $3,310 (200 EMA - 21 SMA)

Early in the American session, gold is trading around 3,306 within the bearish trend channel formed on H1 charts since May 23. The yellow metal is likely to continue

Dimitrios Zappas 18:01 2025-05-28 UTC+2

Forecast for EUR/USD on May 28, 2025

On Tuesday, the EUR/USD pair consolidated below the 1.1374–1.1380 zone and then rebounded from it from below. This confirms the continuation of the downward move, and a close below

Samir Klishi 11:32 2025-05-28 UTC+2

Forex forecast 28/05/2025: NZD/USD, EUR/USD, USD/JPY, Gold, and Bitcoin

Useful links: My other articles are available in this section InstaForex course for beginners Popular Analytics Open trading account Important: The begginers in forex trading need to be very careful

Sebastian Seliga 10:44 2025-05-28 UTC+2

GBP/USD – May 28th: How Will the FOMC Minutes Influence the Market?

On the hourly chart, the GBP/USD pair continued its decline on Tuesday and consolidated below the 161.8% Fibonacci retracement level at 1.3520. This means that the downtrend could continue today

Samir Klishi 09:54 2025-05-28 UTC+2

Technical Analysis of Intraday Price Movement of AUD/JPY Cross Currency Pairs, Wednesday May 28, 2025.

With the appearance of Convergence between the movement of the AUD/JPY currency pair against the Stochastic Oscillator indicator and also confirmed by its price movement which is moving above

Arief Makmur 08:39 2025-05-28 UTC+2

EUR/USD Forecast for May 28, 2025

On Tuesday, the euro underwent a technical correction from the resistance level 1.1420. On the same day, gold declined by 1.14%, WTI crude oil by 0.44%, and government bond yields

Laurie Bailey 05:08 2025-05-28 UTC+2

GBP/USD Forecast for May 28, 2025

On Tuesday, the British pound hesitated to enter the narrow wedge between the price channel line and the target level 1.3635. In the context of a 0.42% strengthening

Laurie Bailey 05:08 2025-05-28 UTC+2

USD/JPY Forecast for May 28, 2025

Yesterday, the USD/JPY pair posted solid growth—0.90% or 149 pips—on the back of a 0.42% strengthening of the U.S. dollar index. As a result, the price is now trading above

Laurie Bailey 05:08 2025-05-28 UTC+2
Can't speak right now?
Ask your question in the chat.
Widget callback
 

Dear visitor,

Your IP address shows that you are currently located in the USA. If you are a resident of the United States, you are prohibited from using the services of InstaFintech Group including online trading, online transfers, deposit/withdrawal of funds, etc.

If you think you are seeing this message by mistake and your location is not the US, kindly proceed to the website. Otherwise, you must leave the website in order to comply with government restrictions.

Why does your IP address show your location as the USA?

  • - you are using a VPN provided by a hosting company based in the United States;
  • - your IP does not have proper WHOIS records;
  • - an error occurred in the WHOIS geolocation database.

Please confirm whether you are a US resident or not by clicking the relevant button below. If you choose the wrong option, being a US resident, you will not be able to open an account with InstaForex anyway.

We are sorry for any inconvenience caused by this message.