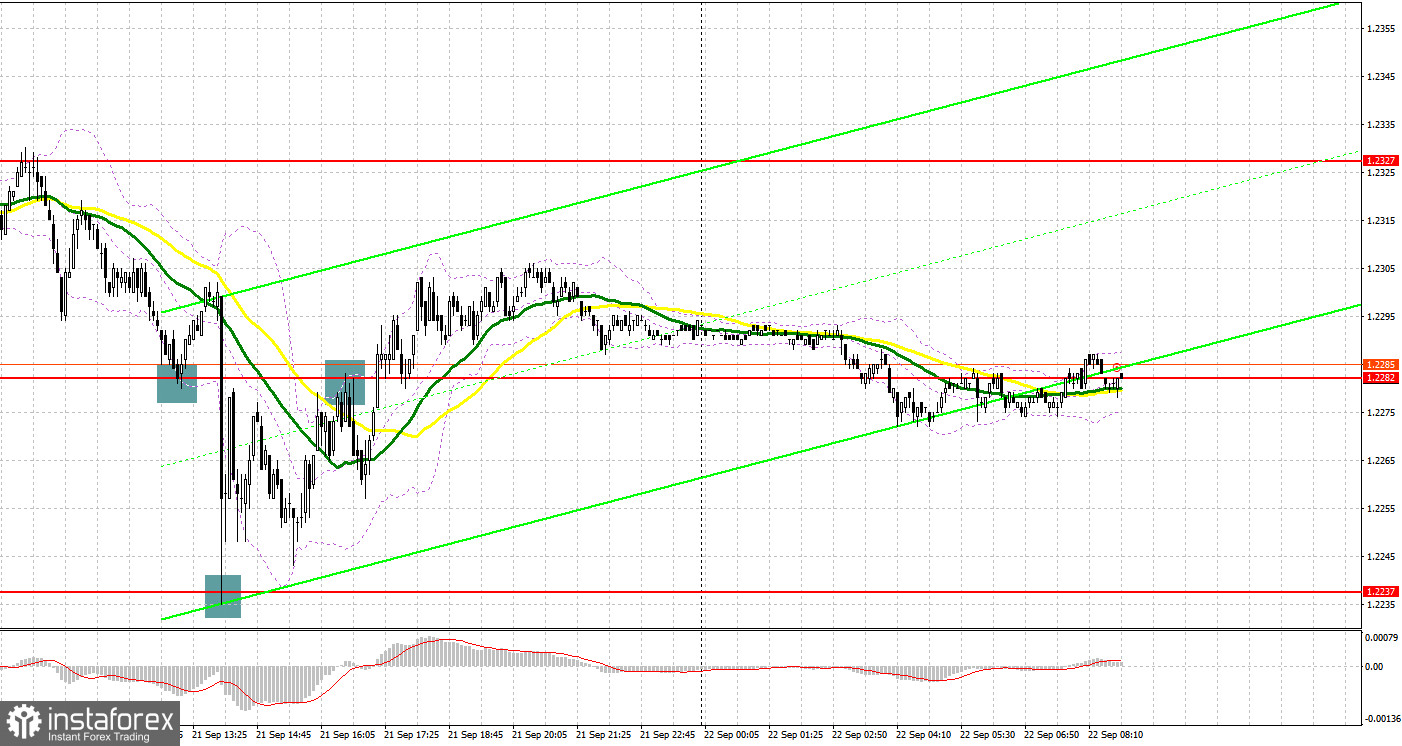
Yesterday, the pair formed several entry signals. Let's see what happened on the 5-minute chart. In my morning review, I mentioned the level of 1.2306 as a possible entry point. A decline and a false breakout at 1.2306 generated a buy signal, but I did not enter against the bear market. Protecting 1.2237 and a false breakout at this mark after the Bank of England's decision produced a buy signal. As a result, the price was up by 30 pips. Selling after a failed consolidation at 1.2282 pulled about 20 more pips out of the market, but there was no major fall.
For long positions on GBP/USD:
The Bank of England announced interest rates would be kept unchanged, hinting that the tightening cycle is not over and if necessary, rates will continue to rise. This made it possible for the bulls to be active around 1.2237, preventing more GBP/USD sell-off. However, the pound could come under pressure today as traders now look to the release of data on the manufacturing sector business activity index, services sector business activity index and the UK PMI composite index for September. Weak figures will exert downward pressure on the pound. Under current conditions, it's best to act around 1.2237, where a false breakout will signal market entry into long positions with a recovery to the nearest resistance at 1.2282, where trading is currently taking place. A breakout and stabilization above this range will bolster buyer confidence, signaling long positions aiming for 1.2327. This level is marked by moving averages that favor the sellers. The more distant target is the 1.2375 area, where I will be taking profits. However, reaching this level will only be feasible with good UK data. If there is another dip to 1.2237 without buyer activity, pressure on the pound will increase, aiming for new monthly lows. In that case, only the defense of 1.2192 and a false breakout there will signal long positions. I plan to buy GBP/USD immediately on a rebound only from the 1.2154 low, aiming for a daily correction of 30-35 pips.
For short positions on GBP/USD:
Bears need to defend the nearest resistance at 1.2282. Ideally, the best scenario would be a false breakout at 1.2282, during the release of weak UK PMIs. This will signal a sell opportunity and GBP/USD may decline towards 1.2237 - a monthly low. A breakout and an upward retest of this range will strike a significant blow to the bulls, opening a downward path to support at 1.2192. The more distant target remains the 1.2154 area, where I will be taking profits. If GBP/USD rises and there is no activity at 1.2282 – which is possible – buyers will get a chance for a correction. In that case, I will postpone selling the pair until a false breakout at 1.2327. If there is no downward movement there, I will sell the pound immediately on a rebound from 1.2375, bearing in mind a 30-35-pips downward intraday correction.
COT report:
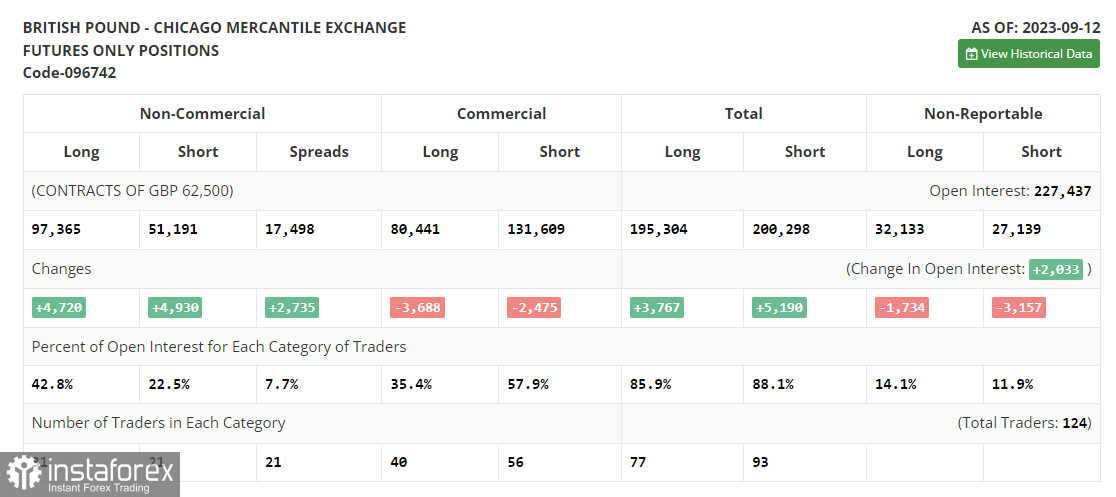
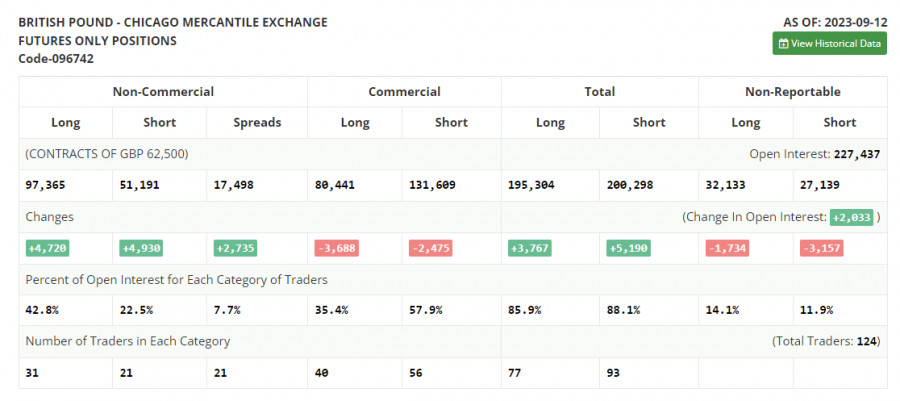
The COT report (Commitments of Traders) for September 12 indicated an increase in both long and short positions. The released data on average earnings in the UK, which clearly has a negative impact on inflation, combined with the decrease in the UK's GDP led to another sell-off in the British pound, which may intensify in the near future. Apart from the Bank of England's meeting, where further actions regarding interest rates are not clear, a consumer price index report is planned. Almost all economists expect an increase in inflationary pressure in the UK in August. Given the backdrop of a weakening economy, we may expect another significant sell-off of the pound against the US dollar. The latest COT report indicates that non-commercial long positions increased by 4,720 to 97,365, while non-commercial short positions also jumped by 4,930 to 51,191. As a result, the spread between long and short positions increased by 2,735. The weekly closing price dropped to 1.2486 from 1.2567.
Indicator signals:
Moving Averages
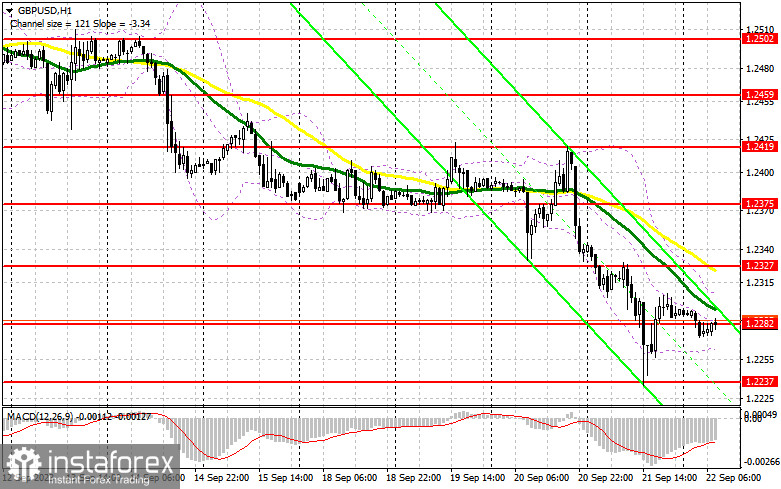
Trading below the 30- and 50-day moving averages indicates a further decline in the pair.
Please note that the time period and levels of the moving averages are analyzed only for the H1 chart, which differs from the general definition of the classic daily moving averages on the D1 chart.
Bollinger Bands
If the pair grows, the upper band of the indicator near 1.2310 will act as resistance.
Description of indicators:
• A moving average of a 50-day period determines the current trend by smoothing volatility and noise; marked in yellow on the chart;
• A moving average of a 30-day period determines the current trend by smoothing volatility and noise; marked in green on the chart;
• MACD Indicator (Moving Average Convergence/Divergence) Fast EMA with a 12-day period; Slow EMA with a 26-day period. SMA with a 9-day period;
• Bollinger Bands: 20-day period;
• Non-commercial traders are speculators such as individual traders, hedge funds, and large institutions who use the futures market for speculative purposes and meet certain requirements;
• Long non-commercial positions represent the total number of long positions opened by non-commercial traders;
• Short non-commercial positions represent the total number of short positions opened by non-commercial traders;
• The non-commercial net position is the difference between short and long positions of non-commercial traders.