Analyzing Monday's trades:
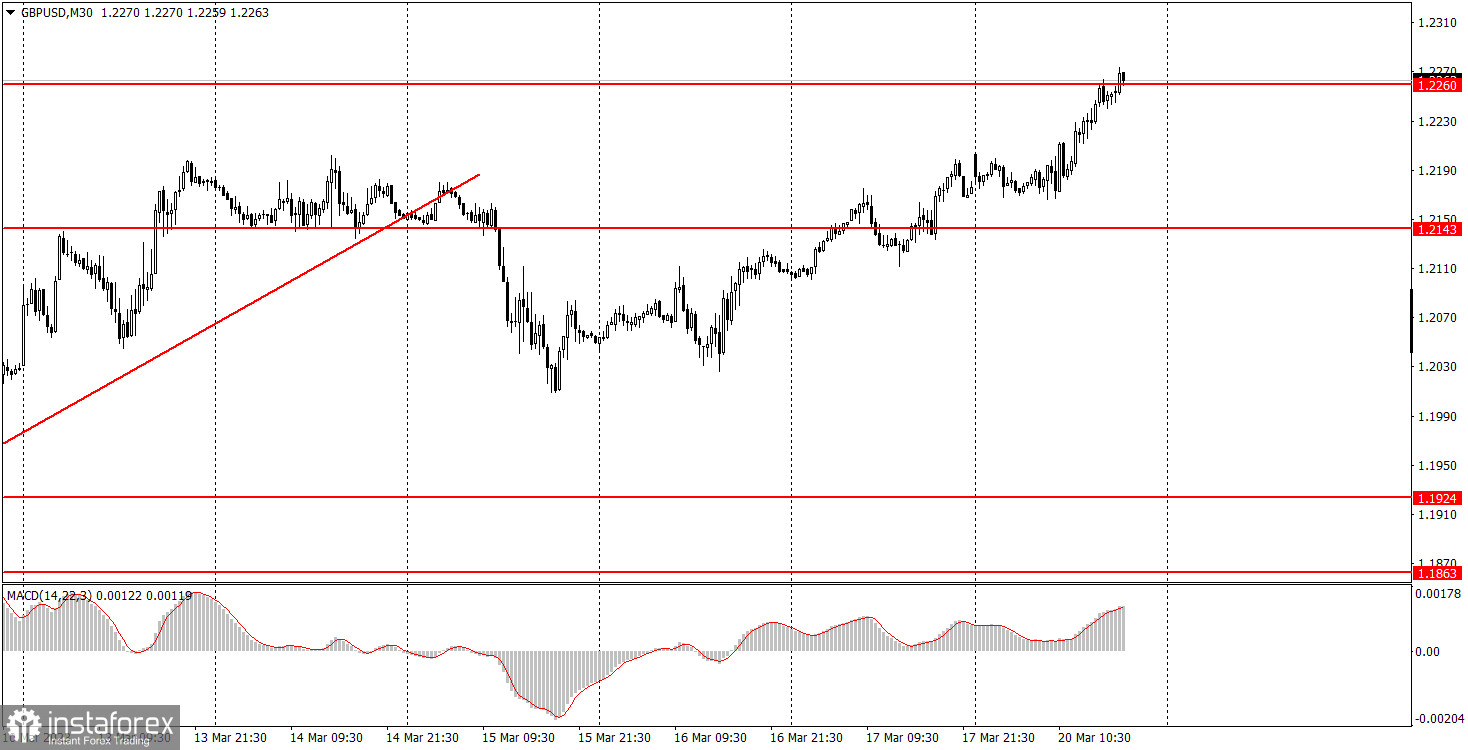
GBP/USD on 30M chart
On Monday, GBP/USD also continued to trade higher, which raises even more questions than the euro's growth. No significant news for the British currency and the dollar. All the events of the day, including European Central Bank President Christine Lagarde's speech, were related only to the euro. Of course, the single currency can pull the pound with it, as the economies of the UK and the EU are still quite closely connected, but it's still quite unusual to see such a "blind obedience" from the pound. However, if you look at it using the technical analysis of the 24-hour chart, everything seems logical. The pair remains inside the horizontal channel of 1.1840-1.2440 and may move to its upper limit even without any fundamental background. Such a movement looks strange in the context of one or several days, but from a global point of view, everything is in order. Plus, the Federal Reserve and the Bank of England will hold meetings this week, and the market may work them out in advance. It is difficult for us to imagine what traders expect from central banks when they buy the pound, but maybe there is some hidden meaning. For example, drive the pair as high as possible in order to start selling it on Wednesday.
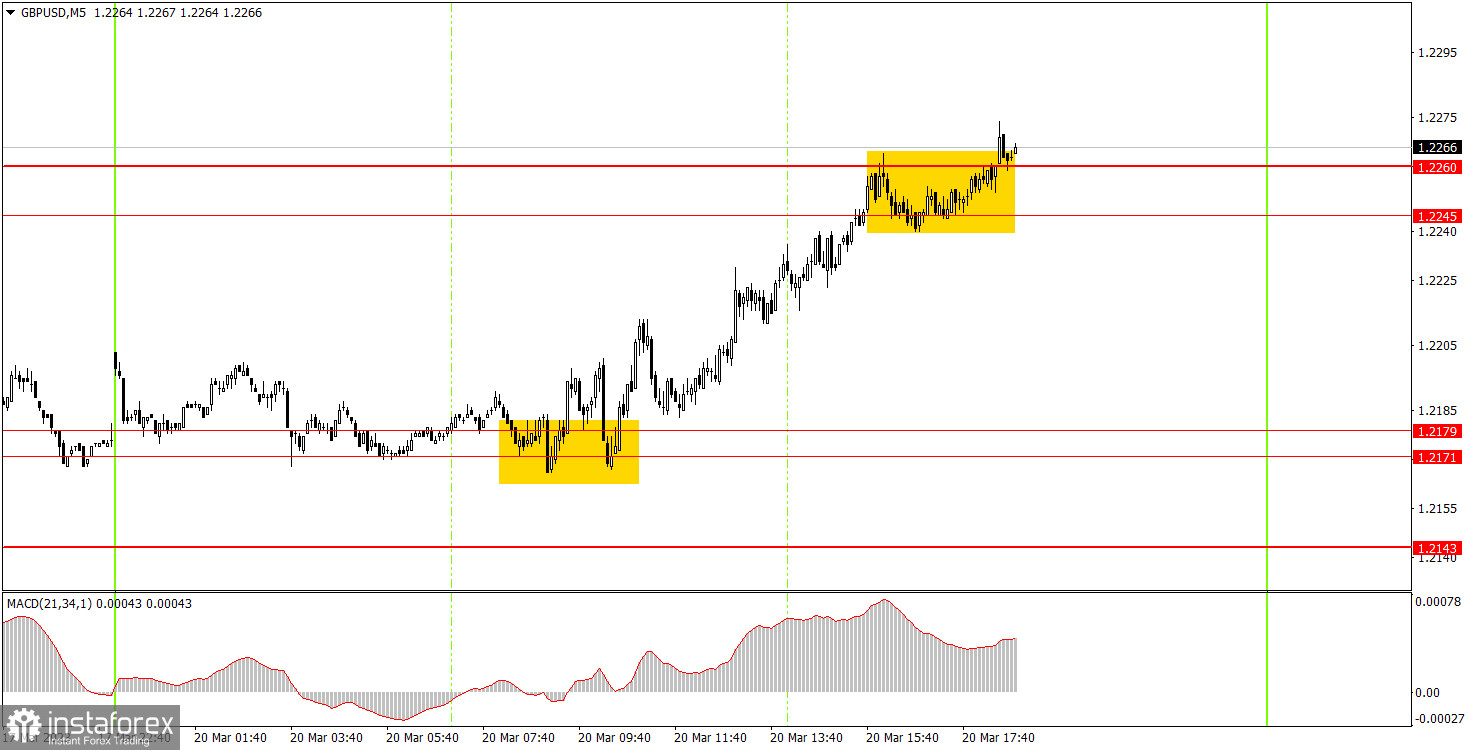
GBP/USD on 5M chart
There was only one trading signal on the 5-minute chart. At the beginning of the European session, the pair rebounded twice from the 1.2171-1.2179 area, after which it went up to 1.2245-1.2260, which was the right place to close the long position. The profit on it was not less than 70 pips. There was a trend during the day and virtually, there was no correction. And this is quite a good development for us. Therefore, there was only one signal and you could have gained good profit on it.
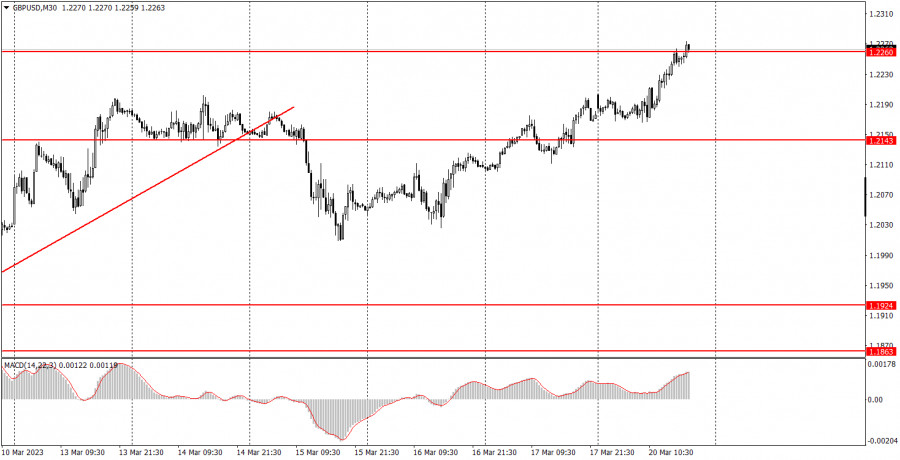
Trading tips on Tuesday:
On the 30-minute chart, GBP/USD continues to trade in the classic "swing", but more in the long term. It is not obvious on the current chart, but when moving to the higher chart it becomes clear as day. Therefore, we should keep in mind that the movements in the near future may be absolutely random. And this week, they could be volatile, because two central banks' meetings will be held. On the 5-minute chart, it is recommended to trade at the levels 1.1924, 1.1992-1.2008, 1.2065-1.2079, 1.2143, 1.2171-1.2179, 1.2245-1.2260, 1.2337-1.2343, 1.2387, 1.2444-1.2471. As soon as the price passes 20 pips in the right direction, you should set a Stop Loss to breakeven. No important events scheduled for Tuesday in either the US or the UK. Traders will have nothing to react to, but later on (Wednesday and Thursday) the BoE and Fed will hold their meetings, and strong movements and trends have already started.
Basic rules of the trading system:
1) The strength of the signal is determined by the time it took the signal to form (a rebound or a breakout of the level). The quicker it is formed, the stronger the signal is.
2) If two or more positions were opened near a certain level based on a false signal (which did not trigger a Take Profit or test the nearest target level), then all subsequent signals at this level should be ignored.
3) When trading flat, a pair can form multiple false signals or not form them at all. In any case, it is better to stop trading at the first sign of a flat movement.
4) Trades should be opened in the period between the start of the European session and the middle of the US trading hours when all positions must be closed manually.
5) You can trade using signals from the MACD indicator on the 30-minute time frame only amid strong volatility and a clear trend that should be confirmed by a trendline or a trend channel.
6) If two levels are located too close to each other (from 5 to 15 pips), they should be considered support and resistance levels.
On the chart:
Support and Resistance levels are the levels that serve as targets when buying or selling the pair. You can place Take Profit near these levels.
Red lines are channels or trend lines that display the current trend and show in which direction it is better to trade now.
The MACD indicator (14, 22, and 3) consists of a histogram and a signal line. When they cross, this is a signal to enter the market. It is recommended to use this indicator in combination with trend patterns (channels and trendlines).
Important announcements and economic reports that can be found on the economic calendar can seriously influence the trajectory of a currency pair. Therefore, at the time of their release, we recommend trading as carefully as possible or exiting the market in order to avoid sharp price fluctuations.
Beginners on Forex should remember that not every single trade has to be profitable. The development of a clear strategy and money management is the key to success in trading over a long period of time.