empty
21.08.2023 10:11 AM
Technical Analysis of GBP/USD for August 21, 2023

Technical Market Outlook:

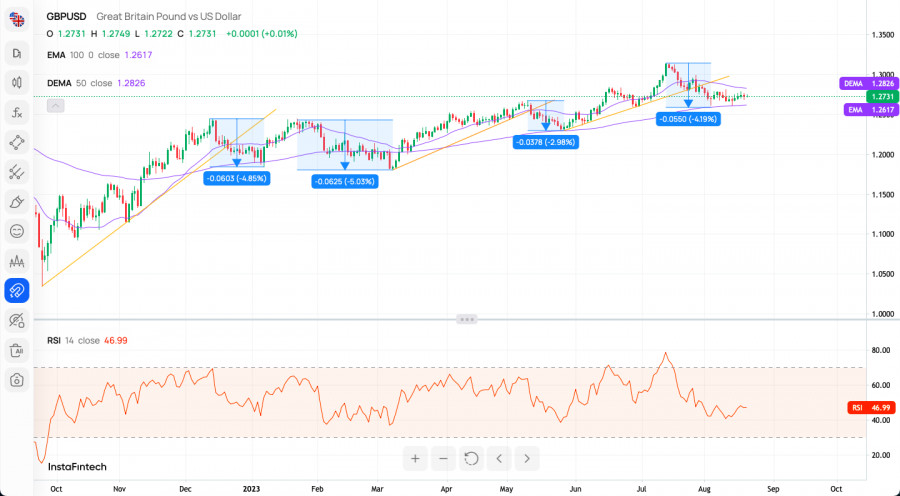
The GBP/USD pair has been seen trading between the 50 and 100 periods moving average as the volatility has decreased. The next target for bears is seen at the level of 1.2590, which is the key short-term technical support level. The recent momentum breakout into the positive territory on the H4 time frame chart supports the short-term bullish outlook for GBP. Only a strong reversal and a breakout above the local supply zone located between the levels of 1.2762 - 1.2797 would change the short-term bearish outlook. Reversal confirmation comes with the level of 1.2826 breakout (100 DMA level).

This image is no longer relevant

Weekly Pivot Points:

WR3 - 1.27925

WR2 - 1.27651

WR1 - 1.27528

Weekly Pivot - 1.27377

WS1 - 1.27254

WS2 - 1.27103

WS3 - 1.26829

Trading Outlook:

The bulls keep continuing the up trend towards the key technical resistance located at the level of 1.3163 and a breakout above this level is needed to extend the up trend towards the last Weekly swing high seen at 1.4248. Only a sustained breakout blow the technical support seen at the level of 1.1775 would change the outlook to bearish.

Select timeframe
5
min
15
min
30
min
1
hour
4
hours
1
day
1
week
Earn on cryptocurrency rate changes with InstaForex
Download MetaTrader 4 and open your first trade
  • Grand Choice
    Contest by
    InstaForex
    InstaForex always strives to help you
    fulfill your biggest dreams.
    JOIN CONTEST

Recommended Stories

GBP/USD – May 28th: How Will the FOMC Minutes Influence the Market?

On the hourly chart, the GBP/USD pair continued its decline on Tuesday and consolidated below the 161.8% Fibonacci retracement level at 1.3520. This means that the downtrend could continue today

Samir Klishi 09:54 2025-05-28 UTC+2

Technical Analysis of Intraday Price Movement of AUD/JPY Cross Currency Pairs, Wednesday May 28, 2025.

With the appearance of Convergence between the movement of the AUD/JPY currency pair against the Stochastic Oscillator indicator and also confirmed by its price movement which is moving above

Arief Makmur 08:39 2025-05-28 UTC+2

EUR/USD Forecast for May 28, 2025

On Tuesday, the euro underwent a technical correction from the resistance level 1.1420. On the same day, gold declined by 1.14%, WTI crude oil by 0.44%, and government bond yields

Laurie Bailey 05:08 2025-05-28 UTC+2

GBP/USD Forecast for May 28, 2025

On Tuesday, the British pound hesitated to enter the narrow wedge between the price channel line and the target level 1.3635. In the context of a 0.42% strengthening

Laurie Bailey 05:08 2025-05-28 UTC+2

USD/JPY Forecast for May 28, 2025

Yesterday, the USD/JPY pair posted solid growth—0.90% or 149 pips—on the back of a 0.42% strengthening of the U.S. dollar index. As a result, the price is now trading above

Laurie Bailey 05:08 2025-05-28 UTC+2

EUR/JPY. Current Market Situation and Forecast

Today, the EUR/JPY pair is attracting buyers after declining during the Asian session to the key 162.00 level. From a technical standpoint, oscillators on both the hourly and daily charts

Irina Yanina 19:28 2025-05-27 UTC+2

Trading Signals for GOLD (XAU/USD) for May 27-29, 2025: buy above $3,281 (6/8 Murray - 21 SMA)

On the other hand, if gold maintains bullish momentum, the price could break above resistance at 3,330, and then we could expect a new bullish sequence, potentially reaching 3,437

Dimitrios Zappas 18:33 2025-05-27 UTC+2

Trading Signals for EUR/USD for May 27-29: sell below 1.1350 (21 SMA - 7/8 Murray)

If the euro breaks the uptrend channel, we could expect a drop towards the 200 EMA located at 1.1230 and could even reach the gap it left

Dimitrios Zappas 18:31 2025-05-27 UTC+2

Forecast for EUR/USD on May 27, 2025

On Monday, the EUR/USD pair returned to the support zone of 1.1374–1.1380. A rebound from this zone would once again work in favor of the euro and a resumption

Samir Klishi 11:47 2025-05-27 UTC+2

Forecast for GBP/USD on May 27, 2025

On the hourly chart, the GBP/USD pair continued to rise on Monday from the 161.8% Fibonacci retracement level at 1.3520. However, in the middle of the day, news broke that

Samir Klishi 11:44 2025-05-27 UTC+2
Can't speak right now?
Ask your question in the chat.
Widget callback
 

Dear visitor,

Your IP address shows that you are currently located in the USA. If you are a resident of the United States, you are prohibited from using the services of InstaFintech Group including online trading, online transfers, deposit/withdrawal of funds, etc.

If you think you are seeing this message by mistake and your location is not the US, kindly proceed to the website. Otherwise, you must leave the website in order to comply with government restrictions.

Why does your IP address show your location as the USA?

  • - you are using a VPN provided by a hosting company based in the United States;
  • - your IP does not have proper WHOIS records;
  • - an error occurred in the WHOIS geolocation database.

Please confirm whether you are a US resident or not by clicking the relevant button below. If you choose the wrong option, being a US resident, you will not be able to open an account with InstaForex anyway.

We are sorry for any inconvenience caused by this message.