empty
05.07.2023 08:19 AM
Technical Analysis of GBP/USD for July 5, 2023

Technical Market Outlook:

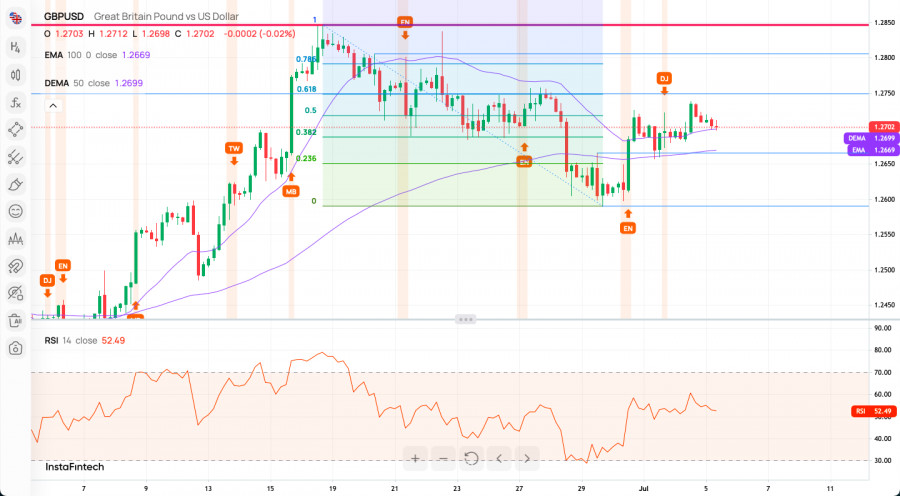
The GBP/USD pair has been rejected from the intraday technical resistance located at 1.2726 and in the short-term the bulls are under pressure. The pair has broken out from the narrow zone located between the levels of 1.2660 - 1.2726 and is currently approaching the 61% Fibonacci retracement level located at 1.2750. The immediate technical support is seen at the level of 1.2659 (100 MA), but the key technical support is seen at 1.2590. Please notice, the momentum is hovering around the level of fifty, so there is a confirmation of the bearish pressure on the lower time frame charts. Only a sustained breakout above the technical resistance would change the outlook to more bullish.

This image is no longer relevant

Weekly Pivot Points:

WR3 - 1.27765

WR2 - 1.27279

WR1 - 1.27004

Weekly Pivot - 1.26793

WS1 - 1.26518

WS2 - 1.26307

WS3 - 1.25821

Trading Outlook:

The 61% Fibonacci retracement located at the level of 1.2778 has been hit, but it does not indicate the corrective cycle to the upside had been terminated. Any sustained breakout above this level and a weekly candle close above it is needed to change the long-term outlook to bullish. The key long term level of technical support is seen at 1.2444. The next long-term target for bulls is seen at the level of 1.3160.

Select timeframe
5
min
15
min
30
min
1
hour
4
hours
1
day
1
week
Earn on cryptocurrency rate changes with InstaForex
Download MetaTrader 4 and open your first trade
  • Grand Choice
    Contest by
    InstaForex
    InstaForex always strives to help you
    fulfill your biggest dreams.
    JOIN CONTEST

Recommended Stories

Forecast for GBP/USD on July 3, 2025

On the hourly chart, the GBP/USD pair on Wednesday rebounded from the 200.0% retracement level at 1.3749, reversed in favor of the U.S. dollar, and fell below the support zone

Samir Klishi 10:03 2025-07-03 UTC+2

If Crude Oil manages to break below the Pivot level, it has the potential to test its nearest Support level, Thursday, July 03, 2025.

Crude Oil, Thursday, July 03, 2025. Poor global economic conditions such as the stagnation of Chinese & European manufacturing have triggered concerns about global Crude Oil demand and expectations

Arief Makmur 07:36 2025-07-03 UTC+2

The Nasdaq 100 index has the potential to test its closest Resistance level, Thursday, July 03, 2025.

Nasdaq 100 Index, Thursday, July 03, 2025. Positive Big Tech Company financial reports and the increasingly strong rumors of the Fed's Dovish policy and the rise of AI innovation have

Arief Makmur 07:36 2025-07-03 UTC+2

EUR/AUD Forecast for July 3, 2025

On the daily chart, the EUR/AUD pair is moving sideways in the upper half of the price channel and above the MACD indicator line. The signal line of the Marlin

Laurie Bailey 06:33 2025-07-03 UTC+2

EUR/USD Forecast for July 3, 2025

Ahead of today's U.S. employment data release for June, the euro consolidated near the price channel line on the daily chart. The long lower shadow of the candlestick suggests that

Laurie Bailey 05:11 2025-07-03 UTC+2

GBP/USD Forecast for July 3, 2025

By the end of yesterday, the British pound had lost 108 pips. Although the reason was not the anticipation of today's U.S. employment data, but rather domestic political turmoil, this

Laurie Bailey 05:11 2025-07-03 UTC+2

Silver Forecast for July 3, 2025

After two days of intense struggle (Monday and Tuesday) between the bulls and bears along the price channel line amid heightened volatility, yesterday we saw the outcome — the bulls

Laurie Bailey 05:11 2025-07-03 UTC+2

Trading Signals for EUR/USD for July 2-5, 2025: sell below 1.1840 (+1/8 Murray - 21 SMA)

If the euro breaks below 1.1762 and consolidates below this price zone, a bearish acceleration is likely and could reach the bottom of the trend channel around 1.1620. It could

Dimitrios Zappas 19:00 2025-07-02 UTC+2

Trading Signals for GOLD (XAU/USD) for July 2-8, 2025: buy above 3,325 (21 SMA - 200 EMA)

Gold could be preparing for a new bullish sequence, so as the price consolidates above 3,325 or 3,312, any technical rebound will be seen as a buying signal, with short-term

Dimitrios Zappas 18:58 2025-07-02 UTC+2

USD/JPY. Analysis, Forecast, and Current Market Situation

Negative oscillators on the 4-hour chart indicate that any further upward movement can be viewed as a selling opportunity. From a technical standpoint, the presence of negative oscillators

Irina Yanina 18:48 2025-07-02 UTC+2
Can't speak right now?
Ask your question in the chat.
Widget callback
 

Dear visitor,

Your IP address shows that you are currently located in the USA. If you are a resident of the United States, you are prohibited from using the services of InstaFintech Group including online trading, online transfers, deposit/withdrawal of funds, etc.

If you think you are seeing this message by mistake and your location is not the US, kindly proceed to the website. Otherwise, you must leave the website in order to comply with government restrictions.

Why does your IP address show your location as the USA?

  • - you are using a VPN provided by a hosting company based in the United States;
  • - your IP does not have proper WHOIS records;
  • - an error occurred in the WHOIS geolocation database.

Please confirm whether you are a US resident or not by clicking the relevant button below. If you choose the wrong option, being a US resident, you will not be able to open an account with InstaForex anyway.

We are sorry for any inconvenience caused by this message.