

signal strength 1 of 5

According to the chart of M5, EURJPY formed the Bearish Symmetrical Triangle pattern. Description: The lower border is 161.15/161.86 and upper border is 162.37/161.86. The pattern width is measured on the chart at -122 pips. The formation of the Bearish Symmetrical Triangle pattern evidently signals a continuation of the downward trend. In other words, if the scenario comes true and EURJPY breaches the lower border, the price could continue its move toward 161.71.
The M5 and M15 time frames may have more false entry points.
See Also
- All
- Double Top
- Flag
- Head and Shoulders
- Pennant
- Rectangle
- Triangle
- Triple top
- All
- #AAPL
- #AMZN
- #Bitcoin
- #EBAY
- #FB
- #GOOG
- #INTC
- #KO
- #MA
- #MCD
- #MSFT
- #NTDOY
- #PEP
- #TSLA
- #TWTR
- AUDCAD
- AUDCHF
- AUDJPY
- AUDUSD
- EURCAD
- EURCHF
- EURGBP
- EURJPY
- EURNZD
- EURRUB
- EURUSD
- GBPAUD
- GBPCHF
- GBPJPY
- GBPUSD
- GOLD
- NZDCAD
- NZDCHF
- NZDJPY
- NZDUSD
- SILVER
- USDCAD
- USDCHF
- USDJPY
- USDRUB
- All
- M5
- M15
- M30
- H1
- D1
- All
- Buy
- Sale
- All
- 1
- 2
- 3
- 4
- 5
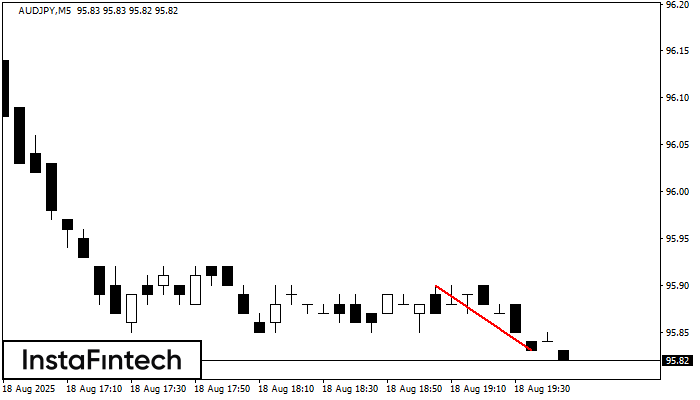
На графике AUDJPY M5 сформировалась фигура «Медвежий флаг», которая сигнализирует о продолжении нисходящего тренда. В случае, если цена зафиксируется ниже минимума фигуры 95.83, движение вниз, скорее всего, продолжится. Перспективой будущего
Таймфреймы М5 и М15 могут иметь больше ложных точек входа.
Открыть график инструмента в новом окне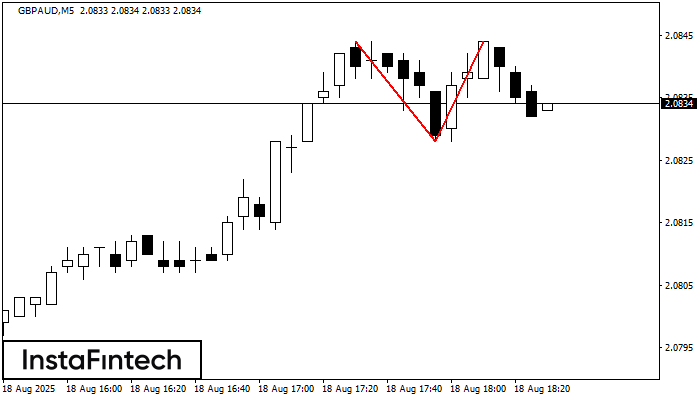
По торговому инструменту GBPAUD на M5 сформировалась фигура «Двойная вершина», которая сигнализирует нам об изменении тенденции с восходящей на нисходящую. Вероятно, что, в случае пробоя основания фигуры 2.0828, возможно дальнейшее
Таймфреймы М5 и М15 могут иметь больше ложных точек входа.
Открыть график инструмента в новом окне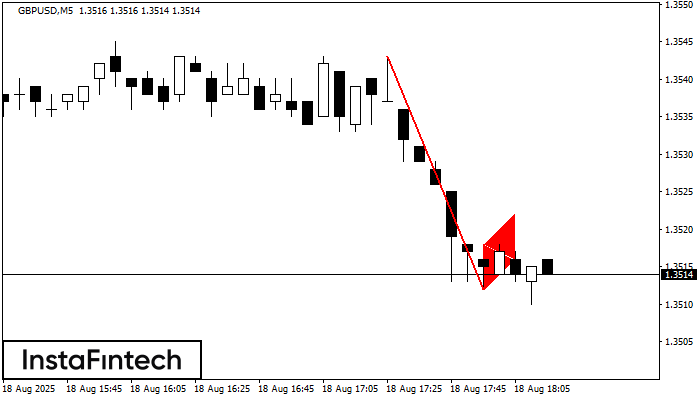
На графике GBPUSD M5 сформировалась графическая фигура «Медвежий флаг». Ссылаясь на теорию графического анализа, можно сказать, что в ближайшее время тренд продолжит нисходящее движение, как только цена зафиксируется ниже минимума
Таймфреймы М5 и М15 могут иметь больше ложных точек входа.
Открыть график инструмента в новом окне


