

signal strength 3 of 5
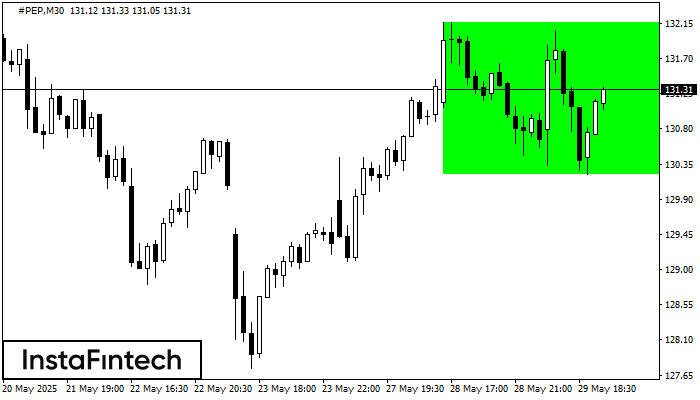
According to the chart of M30, #PEP formed the Bullish Rectangle. The pattern indicates a trend continuation. The upper border is 132.16, the lower border is 130.22. The signal means that a long position should be opened above the upper border 132.16 of the Bullish Rectangle.
- All
- Double Top
- Flag
- Head and Shoulders
- Pennant
- Rectangle
- Triangle
- Triple top
- All
- #AAPL
- #AMZN
- #Bitcoin
- #EBAY
- #FB
- #GOOG
- #INTC
- #KO
- #MA
- #MCD
- #MSFT
- #NTDOY
- #PEP
- #TSLA
- #TWTR
- AUDCAD
- AUDCHF
- AUDJPY
- AUDUSD
- EURCAD
- EURCHF
- EURGBP
- EURJPY
- EURNZD
- EURRUB
- EURUSD
- GBPAUD
- GBPCHF
- GBPJPY
- GBPUSD
- GOLD
- NZDCAD
- NZDCHF
- NZDJPY
- NZDUSD
- SILVER
- USDCAD
- USDCHF
- USDJPY
- USDRUB
- All
- M5
- M15
- M30
- H1
- D1
- All
- Buy
- Sale
- All
- 1
- 2
- 3
- 4
- 5
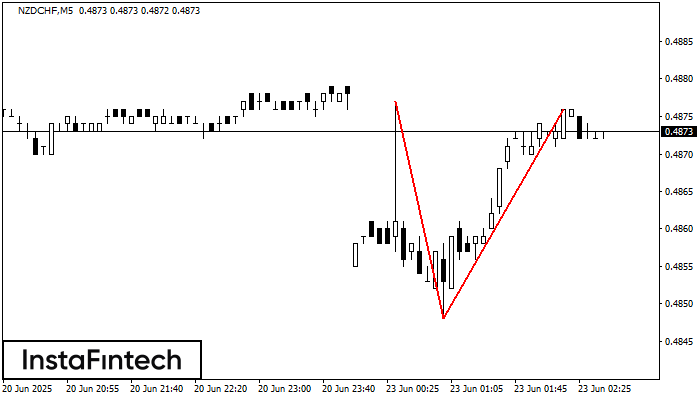
The Double Top pattern has been formed on NZDCHF M5. It signals that the trend has been changed from upwards to downwards. Probably, if the base of the pattern 0.4848
The M5 and M15 time frames may have more false entry points.
Open chart in a new window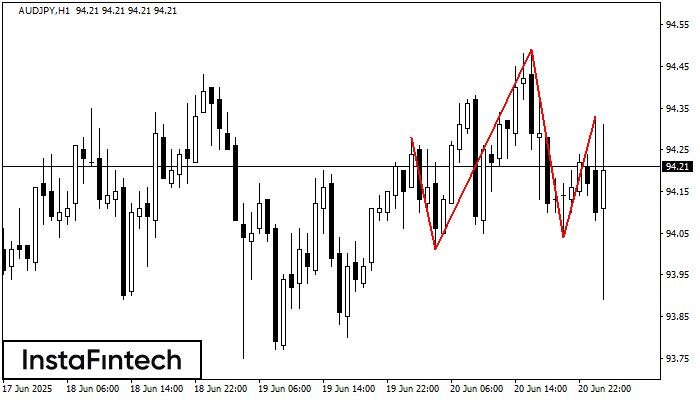
The AUDJPY H1 formed the Head and Shoulders pattern with the following features: The Head’s top is at 94.49, the Neckline and the upward angle are at 94.01/94.04. The formation
Open chart in a new window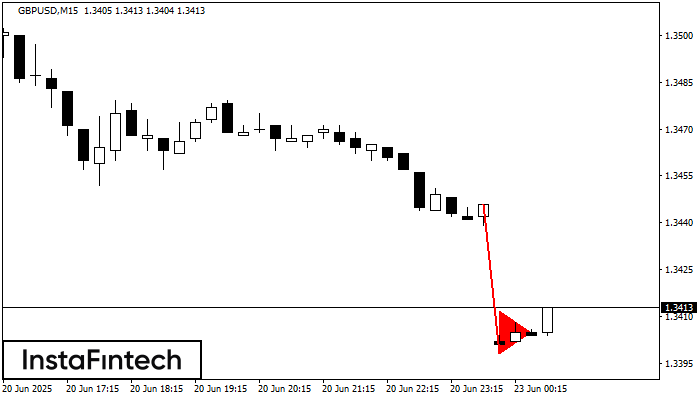
The Bearish pennant pattern has formed on the GBPUSD M15 chart. The pattern signals continuation of the downtrend in case the pennant’s low of 1.3398 is broken through. Recommendations: Place
The M5 and M15 time frames may have more false entry points.
Open chart in a new window


