Bitcoin and Ethereum showed rapid gains but have been flat for a third consecutive day. The Treasury's decision to increase the scale of bond buybacks sparked a crypto market surge, but we have been asking for several days how long this will last given there is effectively only one supporting factor. In essence, it was a "black swan" that arrived at the most unexpected moment. Despite the strong gains for both cryptocurrencies this week, we do not believe the downtrend is over. The fundamental backdrop remains weak for the crypto segment, mainly reflected in capital moving into the AI sector and the Fed's commitment to reach 2% inflation, which implies, at minimum, a continuation of tight monetary policy in the near term. Thus, we still see no basis for a sustained rise in bitcoin and ether. Prospects for the crypto segment have become much more optimistic, but we warn traders: this could be a pump or manipulation.
The most striking thing about the situation is how painfully it resembles October of last year. Then the entire crypto market plunged by tens of percent on a routine speech by Donald Trump; now it has risen, also without clear reasons. Recall that the US Treasury only declared its readiness to increase bond buybacks starting in September. Effectively, that factor has already been priced in. However, for many crypto experts who have a personal interest in continuous gains for the leading cryptocurrency, that fact is irrelevant. As soon as Bitcoin rose, new astronomical forecasts immediately began to appear.
Risk Dimensions said Bitcoin could climb to $180,000 if the US government expands Treasury buybacks and banks gain greater ability to buy long-term bonds (they are currently constrained). Again, we face "if..., then..." formulations. You can come up with countless examples: if the US dollar collapses, bitcoin will rise to $300,000. If the US economy enters a crisis, bitcoin will rise to $1 million. The real question is how much more the US Treasury will buy and for how long — and whether that will push down long-term Treasury yields. Already it can be said that long-term US bond yields are not falling. Therefore, at the moment, the Treasury has merely weakened the dollar and triggered market rallies without achieving the objective that motivated its high-profile decision.
Trading recommendations for BTC/USD
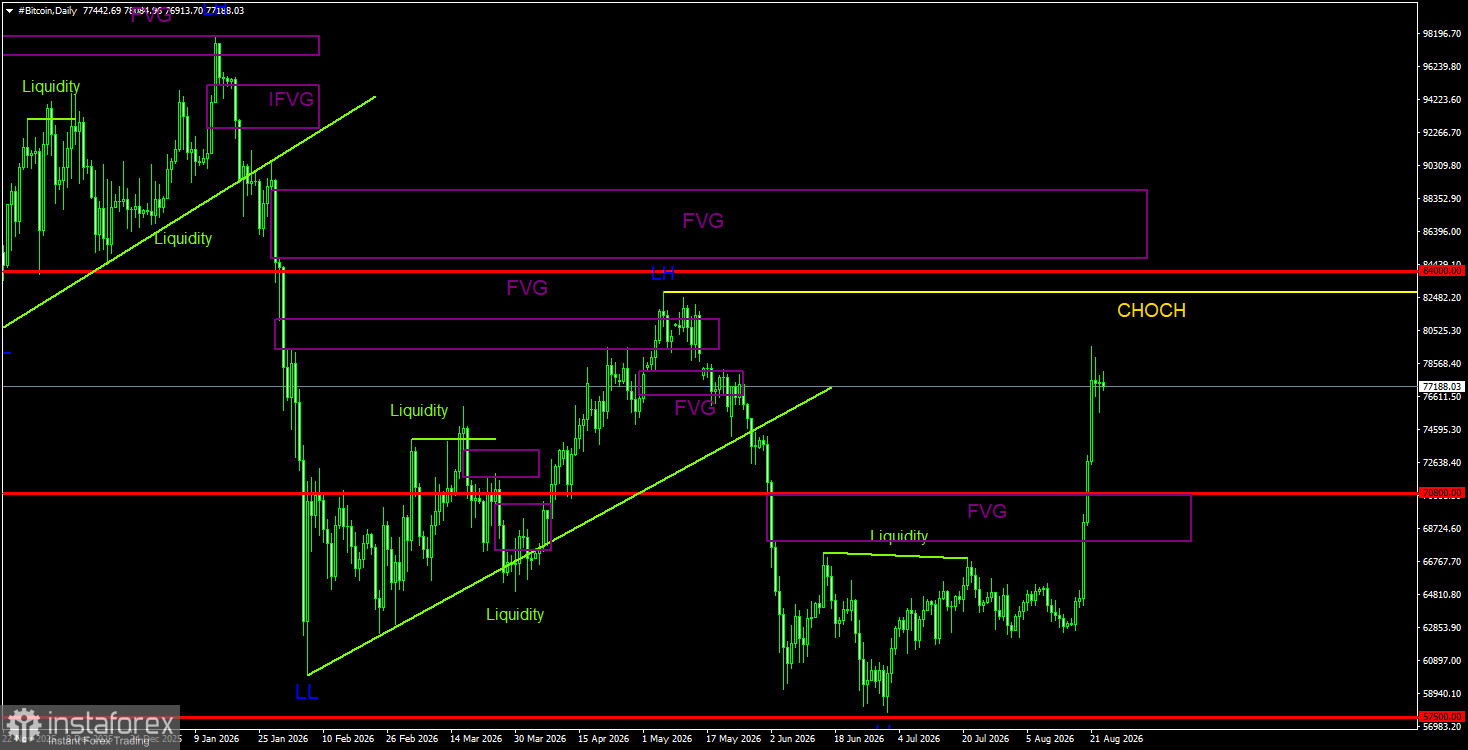
Bitcoin continues to form a downtrend despite the strong rise this week. We continue to expect a decline toward $57,500 (the 61.8% Fibonacci level of the three?year uptrend), although this level has essentially already been tested. We do not believe the downtrend is finished. The latest bearish FVG has been invalidated, and POI areas for short positions on higher timeframes have essentially disappeared. However, on the weekly timeframe, the current rise can still be classified as a correction. We understand the current rise in the leading cryptocurrency hardly looks like a correction, but that is not decisive. Look at the trend segment in 2024, when the price swung up and down for six months.
Trading recommendations for ETH/USD
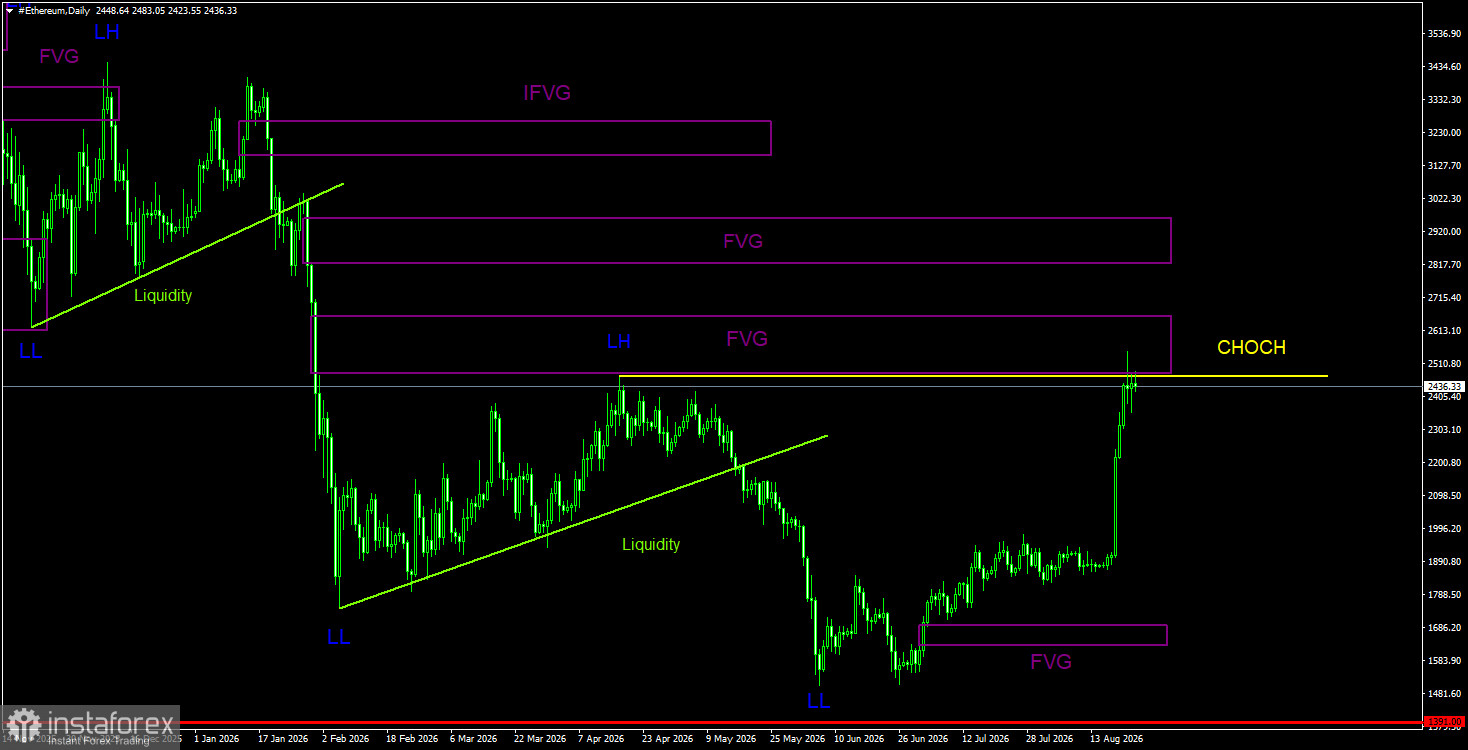
On the daily timeframe, the technical picture has completely changed in just a few days. Ethereum may now be starting a new uptrend, but there are no valid bullish patterns on the 4?hour or daily charts. Essentially, traders can only rely on the weekly chart, where ether could head toward $4,800 — the upper band of a five?year sideways channel. In any case, to open positions, the market needs to calm down and form new, clear patterns. On the daily timeframe, the nearest bearish FVG was worked off, but that FVG belongs to the previous trend; if it triggers a reaction, it will most likely be corrective. On the 4?hour timeframe, a bearish FVG has formed that could produce a reaction within hours. But again, unless Bitcoin falls, Ethereum is unlikely to decline regardless of patterns.
Comments on the charts
CHOCH is a change of character / break of the trend structure. Liquidity means traders' Stop?Losses that market?makers use to build their positions. FVG stands for a Fair Value Gap (area of price inefficiency). The price often moves quickly through such areas, indicating the absence of one side in the market. Later, the price tends to return and react to these zones. IFVG is an Inverted Fair Value Gap. After a return to such a zone, the price does not react but impulsively breaks through and then tests it from the other side.
OB means an Order Block. A candle on which a market?maker opened a position in order to harvest liquidity and then form their own position in the opposite direction.