


signal strength 1 of 5
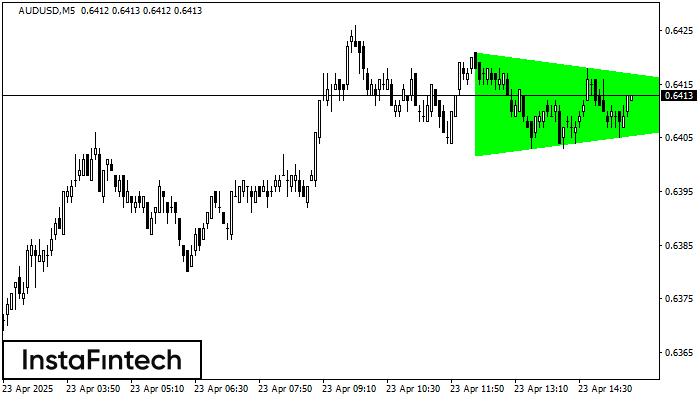
According to the chart of M5, AUDUSD formed the Bullish Symmetrical Triangle pattern. The lower border of the pattern touches the coordinates 0.6402/0.6411 whereas the upper border goes across 0.6421/0.6411. If the Bullish Symmetrical Triangle pattern is in progress, this evidently signals a further upward trend. In other words, in case the scenario comes true, the price of AUDUSD will breach the upper border to head for 0.6426.
The M5 and M15 time frames may have more false entry points.
- All
- Double Top
- Flag
- Head and Shoulders
- Pennant
- Rectangle
- Triangle
- Triple top
- All
- #AAPL
- #AMZN
- #Bitcoin
- #EBAY
- #FB
- #GOOG
- #INTC
- #KO
- #MA
- #MCD
- #MSFT
- #NTDOY
- #PEP
- #TSLA
- #TWTR
- AUDCAD
- AUDCHF
- AUDJPY
- AUDUSD
- EURCAD
- EURCHF
- EURGBP
- EURJPY
- EURNZD
- EURRUB
- EURUSD
- GBPAUD
- GBPCHF
- GBPJPY
- GBPUSD
- GOLD
- NZDCAD
- NZDCHF
- NZDJPY
- NZDUSD
- SILVER
- USDCAD
- USDCHF
- USDJPY
- USDRUB
- All
- M5
- M15
- M30
- H1
- D1
- All
- Buy
- Sale
- All
- 1
- 2
- 3
- 4
- 5
was formed on 07.05 at 01:00:48 (UTC+0)
signal strength 4 of 5
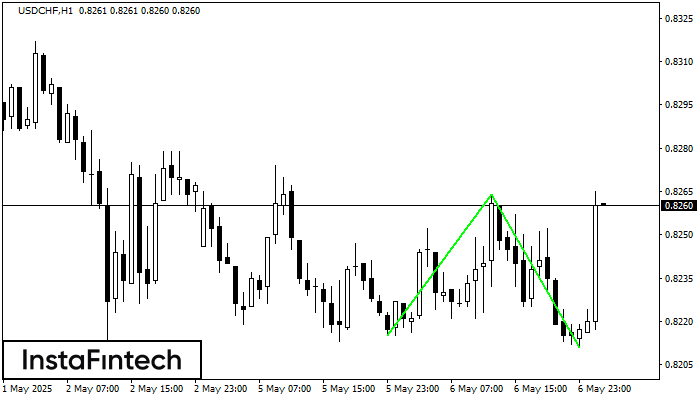
รูปแบบ รูปแบบกราฟจุดสองยอดขาลง (Double Bottom) ถูกสร้างขึ้นมาใน USDCHF H1; ขอบเขตด้านบนอยู่ที่ 0.8264;ขอบเขตด้านล่าง คือ 0.8211 ความกว้างของรูปแบบนี้คือ 49 จุด กรณีที่มีการเคลื่อนตัวทะลุผ่านขอบเขตด้านบน
Open chart in a new windowwas formed on 07.05 at 01:00:39 (UTC+0)
signal strength 4 of 5
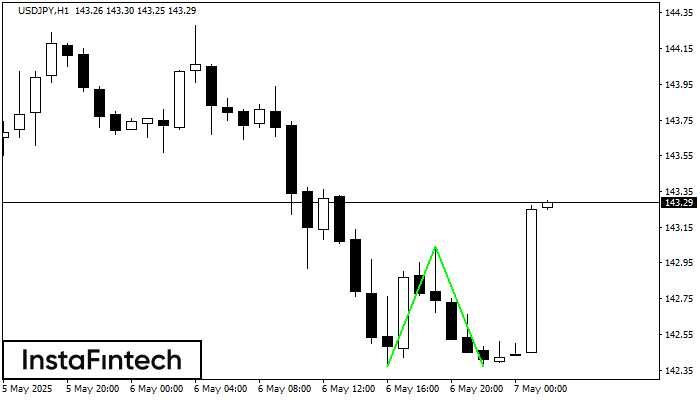
รูปแบบ รูปแบบกราฟจุดสองยอดขาลง (Double Bottom) ถูกสร้างขึ้นมาใน USDJPY H1 คุณลักษณะ: ระดับของแนวรับ 142.37; ระดับของแนวต้าน 143.04; ความกว้างของรูปแบบ 67 จุด
Open chart in a new window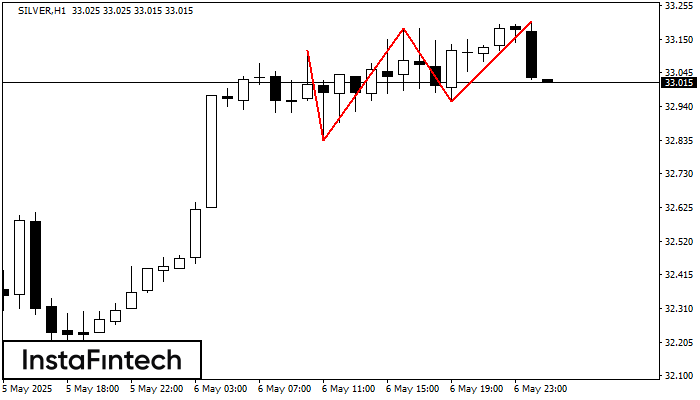
รูปแบบ รูปแบบกราฟจุดสามยอด (Triple Top) ได้สร้างขึ้นมาในชาร์ตของ SILVER H1 คุณลักษณะของกราฟรูปแบบนี้: ขอบเขตมีมุมหงายขึ้น; เส้นด้านล่างของกราฟรูปแบบนี้มีพิกัดอยู่ที่ 32.84/32.95 พร้อมกับลิมิตขาขึ้น 33.12/33.20; ระยะของความกว้างคือ
Open chart in a new window


