signal strength 1 of 5

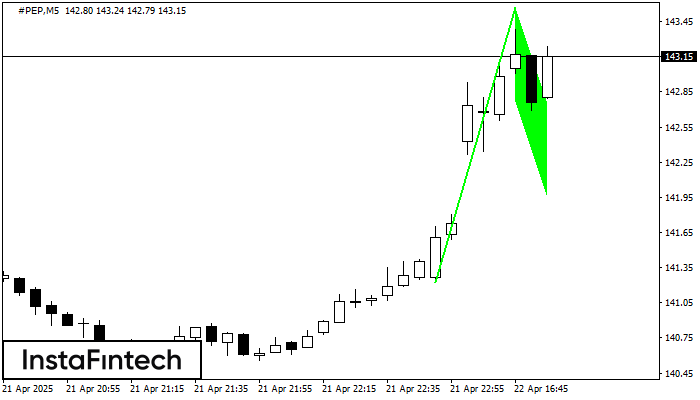
The Bullish Flag pattern has been formed on the chart #PEP M5 which signals that the upward trend will continue. Signals: а break of the peak at 143.57 may push the price higher, and the rise will be the projection of the pole.
The M5 and M15 time frames may have more false entry points.
Vea asimismo
- All
- Double Top
- Flag
- Head and Shoulders
- Pennant
- Rectangle
- Triangle
- Triple top
- All
- #AAPL
- #AMZN
- #Bitcoin
- #EBAY
- #FB
- #GOOG
- #INTC
- #KO
- #MA
- #MCD
- #MSFT
- #NTDOY
- #PEP
- #TSLA
- #TWTR
- AUDCAD
- AUDCHF
- AUDJPY
- AUDUSD
- EURCAD
- EURCHF
- EURGBP
- EURJPY
- EURNZD
- EURRUB
- EURUSD
- GBPAUD
- GBPCHF
- GBPJPY
- GBPUSD
- GOLD
- NZDCAD
- NZDCHF
- NZDJPY
- NZDUSD
- SILVER
- USDCAD
- USDCHF
- USDJPY
- USDRUB
- All
- M5
- M15
- M30
- H1
- D1
- All
- Buy
- Sale
- All
- 1
- 2
- 3
- 4
- 5
The Bullish pennant pattern is formed on the #TSLA M5 chart. It is a type of the continuation pattern. Supposedly, in case the price is fixed above the pennant’s high
The M5 and M15 time frames may have more false entry points.
Open chart in a new windowAccording to the chart of M5, #PEP formed the Bearish Rectangle. This type of a pattern indicates a trend continuation. It consists of two levels: resistance 133.83 - 0.00
The M5 and M15 time frames may have more false entry points.
Open chart in a new windowAccording to the chart of M5, #PEP formed the Bearish Rectangle. The pattern indicates a trend continuation. The upper border is 133.83, the lower border is 132.94. The signal means
The M5 and M15 time frames may have more false entry points.
Open chart in a new window