empty
06.05.2025 03:32 AM
Trading Recommendations and Analysis for GBP/USD on May 6: Trump vs. ISM

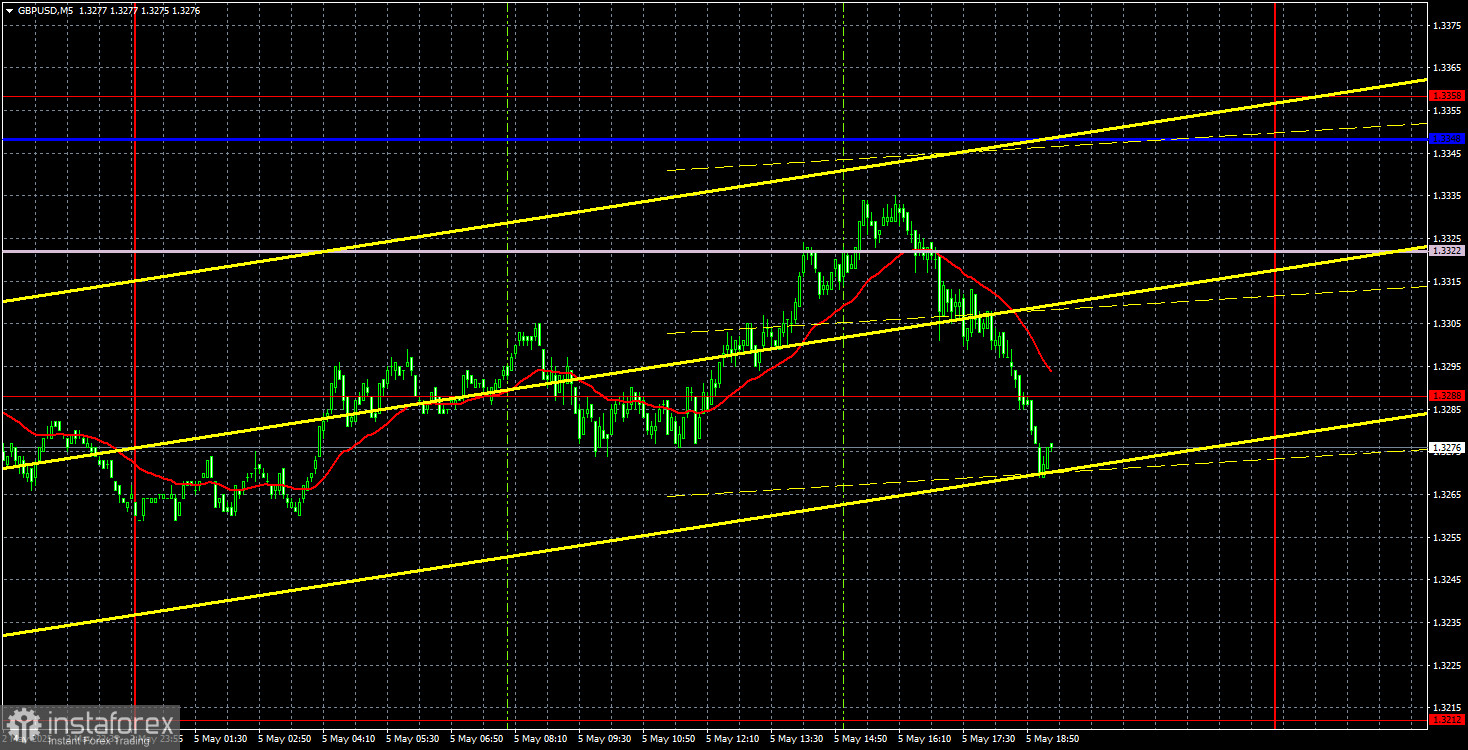
GBP/USD 5-Minute Analysis

This image is no longer relevant

On Monday, the GBP/USD currency pair intended to launch a new wave of the upward trend that has been ongoing for several months. However, in the second half of the day, the market unexpectedly reacted to the U.S. ISM Services PMI report, allowing the dollar to improve its intraday position slightly. There was no significant rally in the U.S. currency, of course. Let us recall that last week's Q1 GDP report was a complete failure—yet the market looked the other way. Still, it's impossible to ignore the approaching recession and the potential for monetary easing by the Federal Reserve in the second half of 2025. Thus, even though the market has been ignoring virtually all dollar-positive news for two months, it's clear that such news is becoming increasingly scarce. And with that, the dollar's already slim chances for growth are fading.

For the U.S. currency to show any meaningful chart-based growth, a de-escalation of the global trade war is needed. Unfortunately, that remains virtually the only supportive factor for the dollar. Perhaps over time, traders will stop focusing solely on this and the "Trump factor," but little has changed for now. Two weeks ago, even the most recent sharp dollar surge followed President Trump's decision not to fire Jerome Powell.

Monday's movements on the 5-minute timeframe were once again technically erratic. The market continues to disregard technical levels and indicators. Technically speaking, the price bounced off the Ichimoku indicator lines during the U.S. trading session—but this rebound didn't look convincing. The 1.3288 level was ignored all day and offered no resistance to price action. Once again, we remind you that technical reference points and macroeconomic and fundamental signals are far from reliable in the current environment.
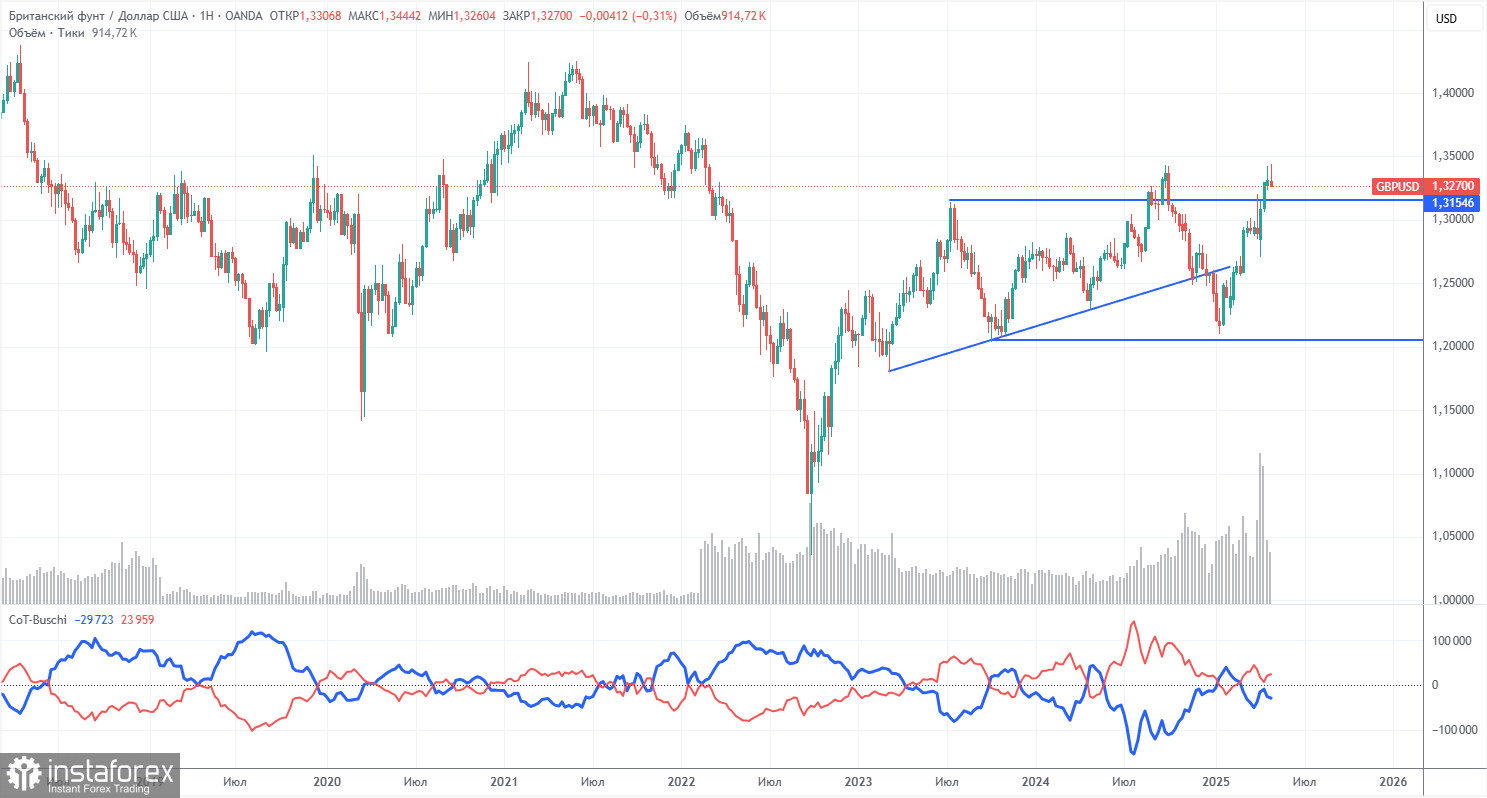
COT Report

This image is no longer relevant

COT reports for the British pound show that commercial traders' sentiment has constantly shifted in recent years. The red and blue lines—representing net positions of commercial and non-commercial traders—frequently intersect and mostly hover near the zero mark. That's the case now, indicating a relatively balanced number of long and short positions.

On the weekly timeframe, the price initially broke through the 1.3154 level, then surpassed the trend line, returned to 1.3154, and broke it again. Breaking the trend line suggests a high probability of further pound depreciation. However, the dollar continues to fall due to Donald Trump. Therefore, despite technical signals, news about the trade war could keep pushing the pound higher.

According to the latest report on the British pound, the "Non-commercial" group closed 2,900 BUY contracts and 6,400 SELL contracts. As a result, the net position of non-commercial traders increased by 3,500 contracts.

The fundamental backdrop still does not justify long-term buying of the pound sterling, and the currency remains at real risk of resuming a broader downtrend. The pound has gained significantly recently, but it's important to understand that this was due to Donald Trump's policies.

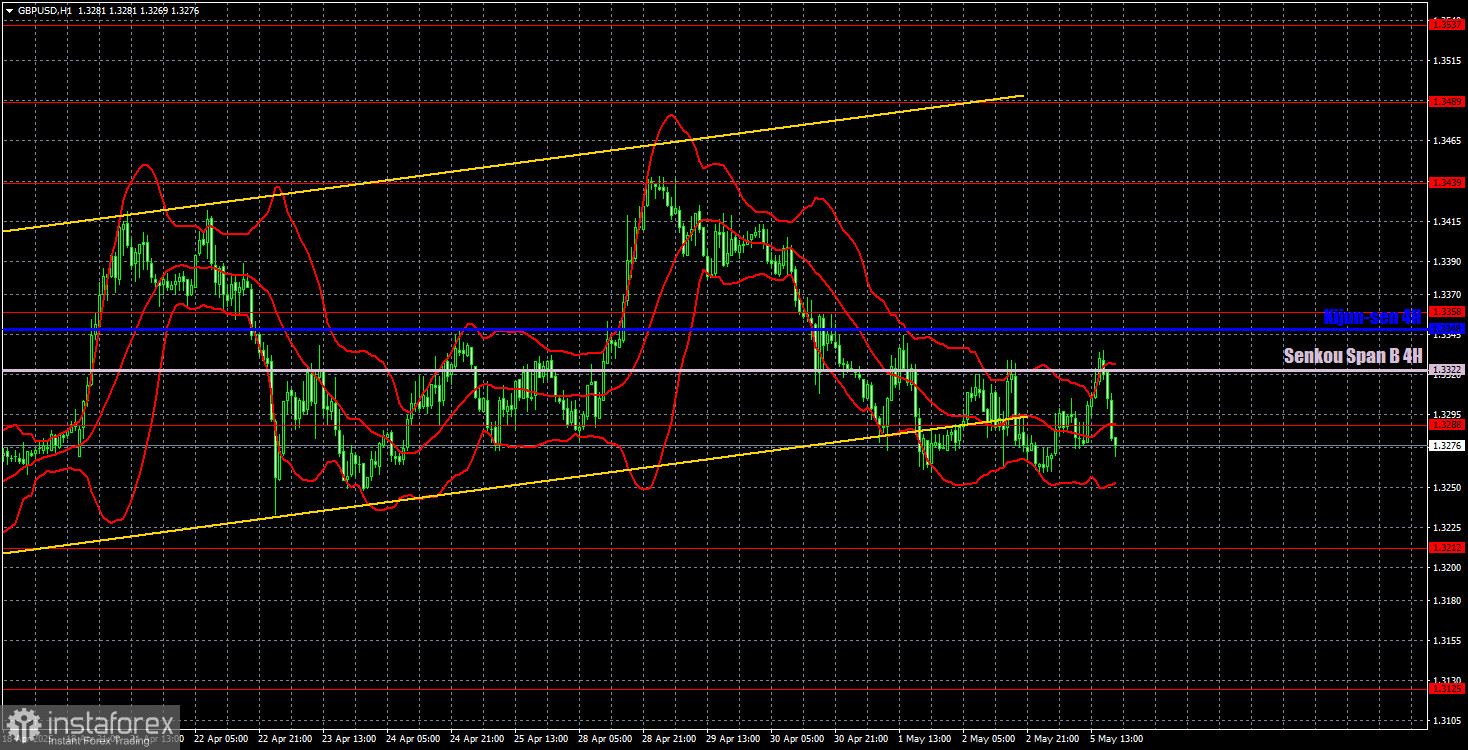
GBP/USD 1-Hour Analysis

This image is no longer relevant

On the hourly timeframe, GBP/USD maintains its upward trend, albeit slower and with occasional corrections. The pound has shown strong growth in recent months, though it owes this entirely to the dollar's weakness triggered by Trump. That dynamic is still unfolding. The market is paying virtually no attention to macroeconomic data. Thus, the chaos and lack of clear logic persist.

For May 6, we highlight the following important levels: 1.2691-1.2701, 1.2796-1.2816, 1.2863, 1.2981-1.2987, 1.3050, 1.3125, 1.3212, 1.3288, 1.3358, 1.3439, 1.3489, 1.3537. Senkou Span B (1.3322) and Kijun-sen (1.3348) lines can also be sources of signals. Setting the Stop Loss level to breakeven when the price passes 20 pips in the right direction is recommended. The Ichimoku indicator lines may shift throughout the day and should be considered when identifying signals.

On Tuesday, the U.K. is scheduled to release the second estimate of the Services PMI, which is unlikely to attract much trader attention. The U.S. macroeconomic calendar is empty. We'll likely see low volatility and a sideways trading pattern today.

Illustration Explanations:

  • Support and resistance price levels – thick red lines where movement may end. They are not trading signal sources.
  • Kijun-sen and Senkou Span B lines—These are strong Ichimoku indicator lines transferred to the hourly timeframe from the 4-hour one.
  • Extremum levels – thin red lines where the price has previously rebounded. These act as trading signal sources.
  • Yellow lines – trend lines, trend channels, and other technical patterns.
  • COT Indicator 1 on the charts – the size of the net position for each category of traders.
Seleccione el marco de tiempo
5
min
15
min
30
min
1
hora
4
horas
1
día
1
s.
Gana con los cambios en el valor de las criptomonedas con InstaForex.
Descarga MetaTrader 4 y abre tu primera operación.
  • Grand Choice
    Contest by
    InstaForex
    InstaForex always strives to help you
    fulfill your biggest dreams.
    UNIRSE AL CONCURSO

Recommended Stories

Ayer se formaron varios puntos de entrada al mercado. Vamos a mirar el gráfico de 5 minutos y analizar lo que ocurrió. En mi pronóstico matutino presté atención al nivel

Miroslaw Bawulski 08:47 2025-06-05 UTC+2

EUR/USD: plan para la sesión europea del 5 de junio. Informes COT (Commitment of Traders) (análisis de las operaciones de ayer). El euro se beneficia de la debilidad del dólar

EUR/USD: plan para la sesión europea del 5 de junio. Informes COT (Commitment of Traders) (análisis de las operaciones de ayer). El euro se beneficia de la debilidad del dólar

Miroslaw Bawulski 08:46 2025-06-05 UTC+2

GBP/USD: plan para la sesión europea del 4 de junio. Informes COT (Commitment of Traders) (análisis de las operaciones de ayer). Demostrar un crecimiento es cada vez más difícil

Ayer se formaron varios puntos de entrada al mercado. Veamos el gráfico de 5 minutos y analicemos lo que ocurrió allí. En mi pronóstico matutino presté atención al nivel

Miroslaw Bawulski 08:27 2025-06-04 UTC+2

EUR/USD: plan para la sesión europea del 4 de junio. Informes COT (Commitment of Traders) (análisis de las operaciones de ayer). El euro no mantuvo las posiciones

Ayer se formó solo un punto de entrada al mercado. Veamos el gráfico de 5 minutos y analicemos lo que ocurrió allí. En mi pronóstico matutino presté atención al nivel

Miroslaw Bawulski 08:27 2025-06-04 UTC+2

GBP/USD: plan para la sesión europea del 3 de junio. Informes COT (Commitment of Traders) (análisis de las operaciones de ayer). La libra se mantiene en el canal

Ayer se formaron varios puntos de entrada al mercado. Veamos el gráfico de 5 minutos y analicemos que ocurrió. En mi pronóstico matutino presté atención al nivel 1.3555 y planeé

Miroslaw Bawulski 07:22 2025-06-03 UTC+2

EUR/USD: plan para la sesión europea del 3 de junio. Informes COT (Commitment of Traders) (análisis de las operaciones de ayer). El euro actualiza el máximo mensual

Ayer se formaron varios puntos de entrada al mercado. Veamos el gráfico de 5 minutos y analicemos que ocurrió. En mi pronóstico matutino presté atención al nivel 1.1416 y planeé

Miroslaw Bawulski 07:22 2025-06-03 UTC+2

GBP/USD: plan para la sesión europea del 2 de junio. Informes COT (Commitment of Traders) (análisis de las operaciones de ayer). La libra no cesa en sus intentos de subir

GBP/USD: plan para la sesión europea del 2 de junio. Informes COT (Commitment of Traders) (análisis de las operaciones de ayer). La libra no cesa en sus intentos de subir

Miroslaw Bawulski 08:29 2025-06-02 UTC+2

EUR/USD: plan para la sesión europea del 2 de junio. Informes COT (Commitment of Traders) (análisis de las operaciones de ayer). El euro no se rinde

El pasado viernes se formaron varios puntos de entrada al mercado. Veamos el gráfico de 5 minutos y analicemos lo que ocurrió allí. En mi pronóstico matutino presté atención

Miroslaw Bawulski 08:29 2025-06-02 UTC+2

GBP/USD: plan para la sesión europea del 28 de mayo. Informes COT (análisis de las operaciones de ayer) La libra sigue perdiendo terreno

Ayer se formaron varios puntos de entrada al mercado. Veamos el gráfico de 5 minutos y analicemos lo que ocurrió. En mi pronóstico matutino, presté atención al nivel 1.3545

Miroslaw Bawulski 08:07 2025-05-28 UTC+2

EUR/USD: plan para la sesión europea del 28 de mayo. Informes COT (análisis de las operaciones de ayer) El euro continúa cayendo

Ayer se formaron varios puntos de entrada al mercado. Veamos el gráfico de 5 minutos y analicemos lo que ocurrió. En mi pronóstico matutino, presté atención al nivel 1.1374

Miroslaw Bawulski 08:07 2025-05-28 UTC+2
¿No puede hablar ahora mismo?
Ingrese su pregunta en el chat.
Widget callback
 

Dear visitor,

Your IP address shows that you are currently located in the USA. If you are a resident of the United States, you are prohibited from using the services of InstaFintech Group including online trading, online transfers, deposit/withdrawal of funds, etc.

If you think you are seeing this message by mistake and your location is not the US, kindly proceed to the website. Otherwise, you must leave the website in order to comply with government restrictions.

Why does your IP address show your location as the USA?

  • - you are using a VPN provided by a hosting company based in the United States;
  • - your IP does not have proper WHOIS records;
  • - an error occurred in the WHOIS geolocation database.

Please confirm whether you are a US resident or not by clicking the relevant button below. If you choose the wrong option, being a US resident, you will not be able to open an account with InstaForex anyway.

We are sorry for any inconvenience caused by this message.